A wastewater treatment plant never measures itself at a single point. Raw sewage that enters the headworks looks nothing like the clean effluent that leaves at the far end, and the water changes profoundly at every stage in between. That makes situational awareness hard: an operator does not just need the current numbers, they need to know whether each stage is sitting inside its healthy operating window, and which stage, if any, is drifting toward a permit violation. In this article we look at a control-room dashboard that puts the entire treatment train on one screen, so a glance from across the room tells the shift exactly where things stand.
One board that mirrors the plant
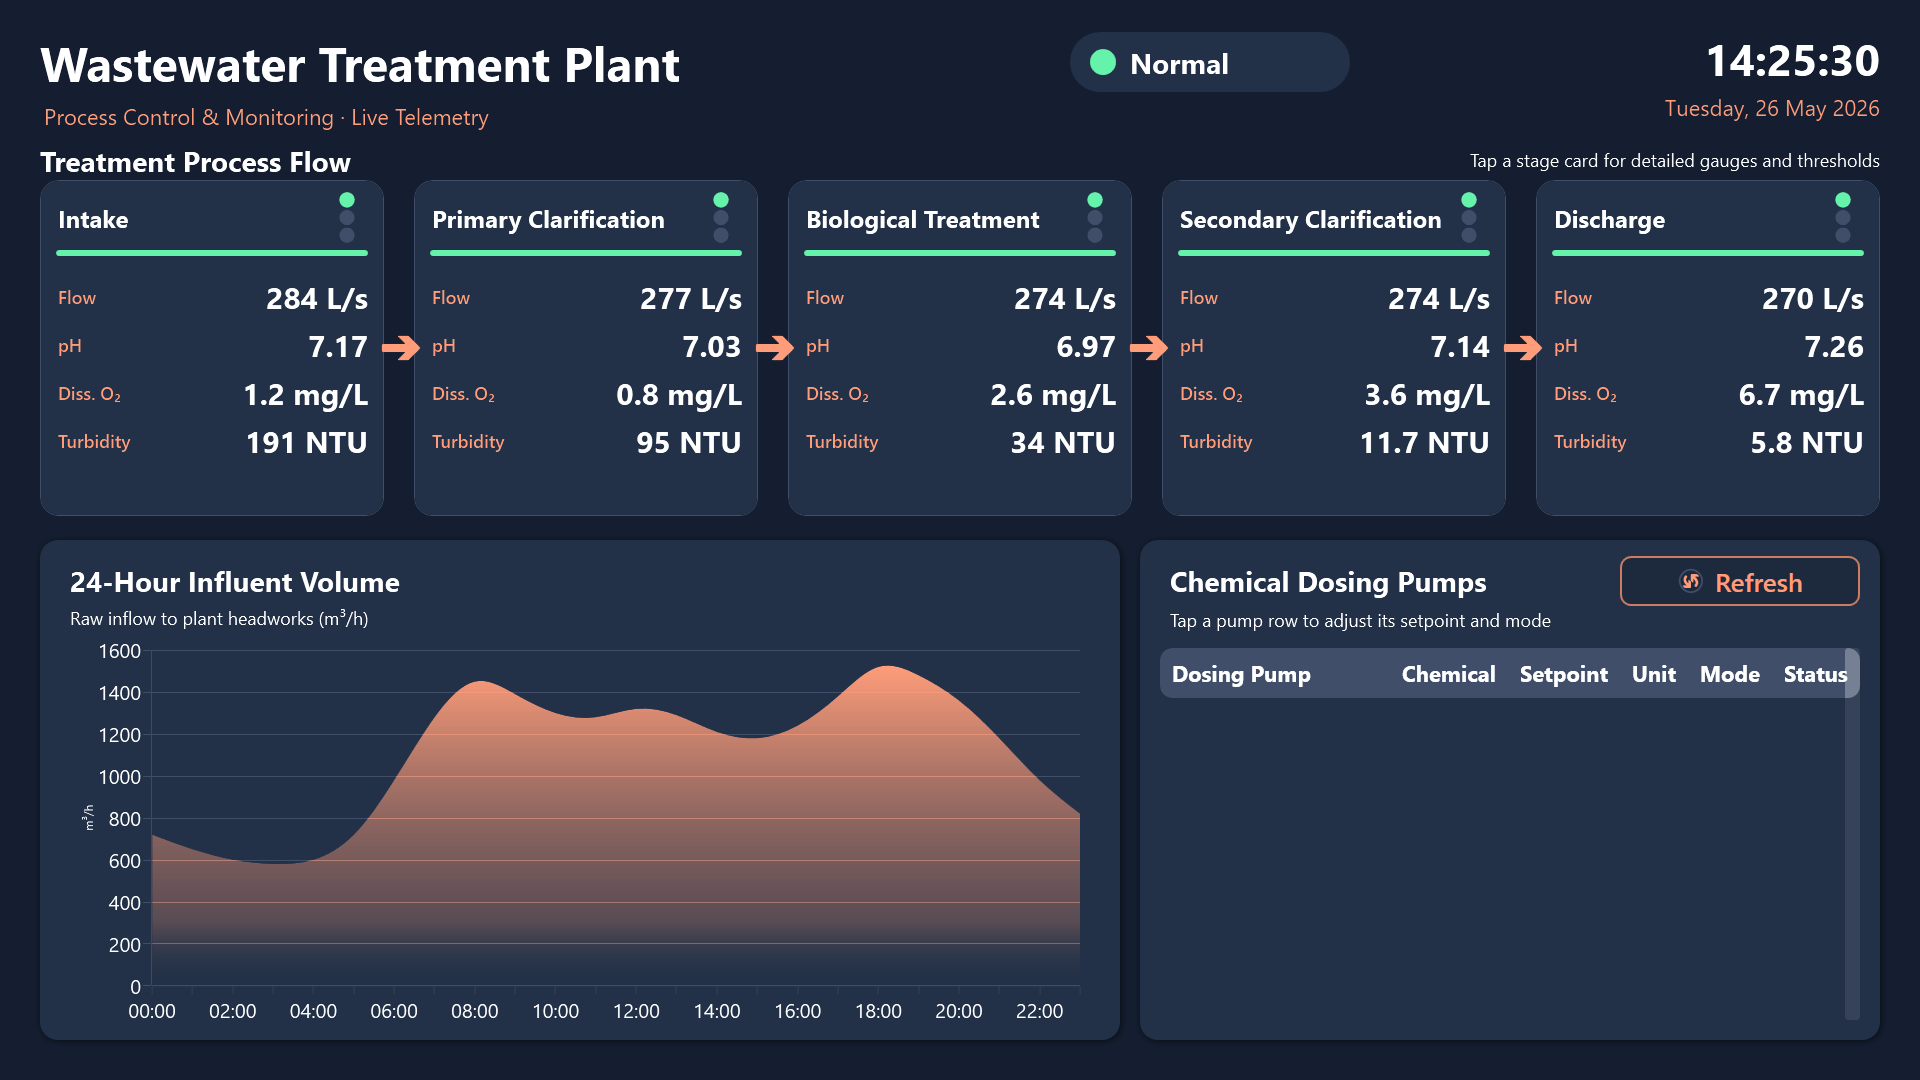
The dashboard is built to live on a large control-room wall display or a touch panel mounted near the process line. Shift operators, plant supervisors, and maintenance technicians all read the same picture and act on it directly. The five treatment stages, intake, primary clarification, biological treatment, secondary clarification, and discharge, are laid out left to right with flow arrows between them, so the board mirrors the physical plant.
That layout is the whole point. Because the stages run in the same order as the water does, the propagation of a problem becomes obvious. If turbidity is high at intake but recovers by the time it reaches discharge, the process is doing its job. If it stays high downstream, something is wrong, and the operator can see at once how far the trouble has spread.
A top strip carries the plant name and a live overall status pill, Normal, Warning, or Alarm, next to a large clock and date. From across the room, that single pill confirms the health of the operation before anyone reads a single number. Each of the five stage cards then surfaces the four parameters that matter most: flow rate in litres per second, pH, dissolved oxygen in mg/L, and turbidity in NTU, each backed by a coloured status bar and a traffic-light signal block.
Anticipating load and watching the chemistry
The lower half of the board splits into two working areas. On the left, a 24-hour spline-area chart traces the influent volume in cubic metres per hour. This captures the classic diurnal pattern every plant lives with: low overnight flow, a morning peak as the town wakes up, and an evening peak after dinner. Seeing that curve in advance lets operators anticipate hydraulic loading and schedule backwash or sludge wasting around the quiet hours instead of fighting a peak.
On the right sits a live table of chemical dosing pumps. Each row names the pump, the chemical it meters (a coagulant, a pH adjuster, or a disinfectant, for example), its current setpoint, its operating mode, and its run status. Row colours do the triage for you: a faulted pump turns red and pulls the eye immediately, so a dosing problem never hides in a wall of text.
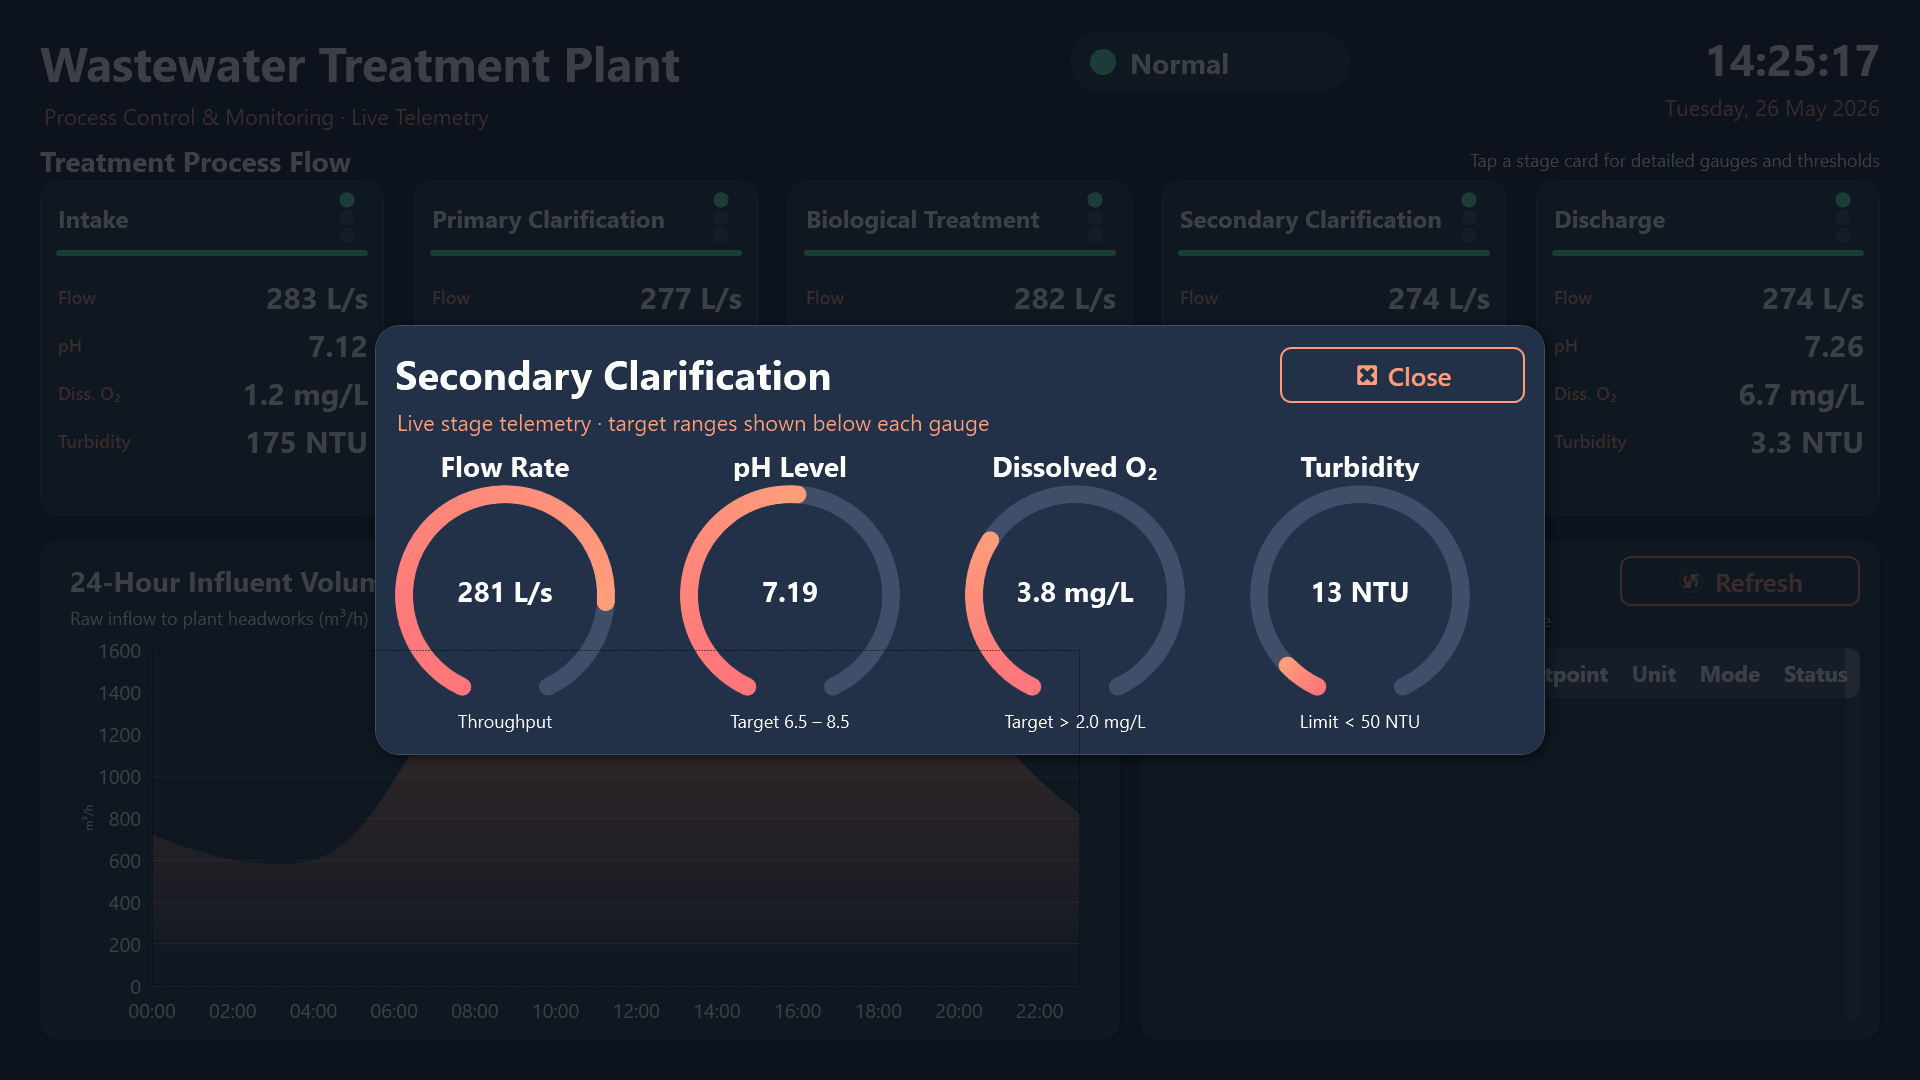
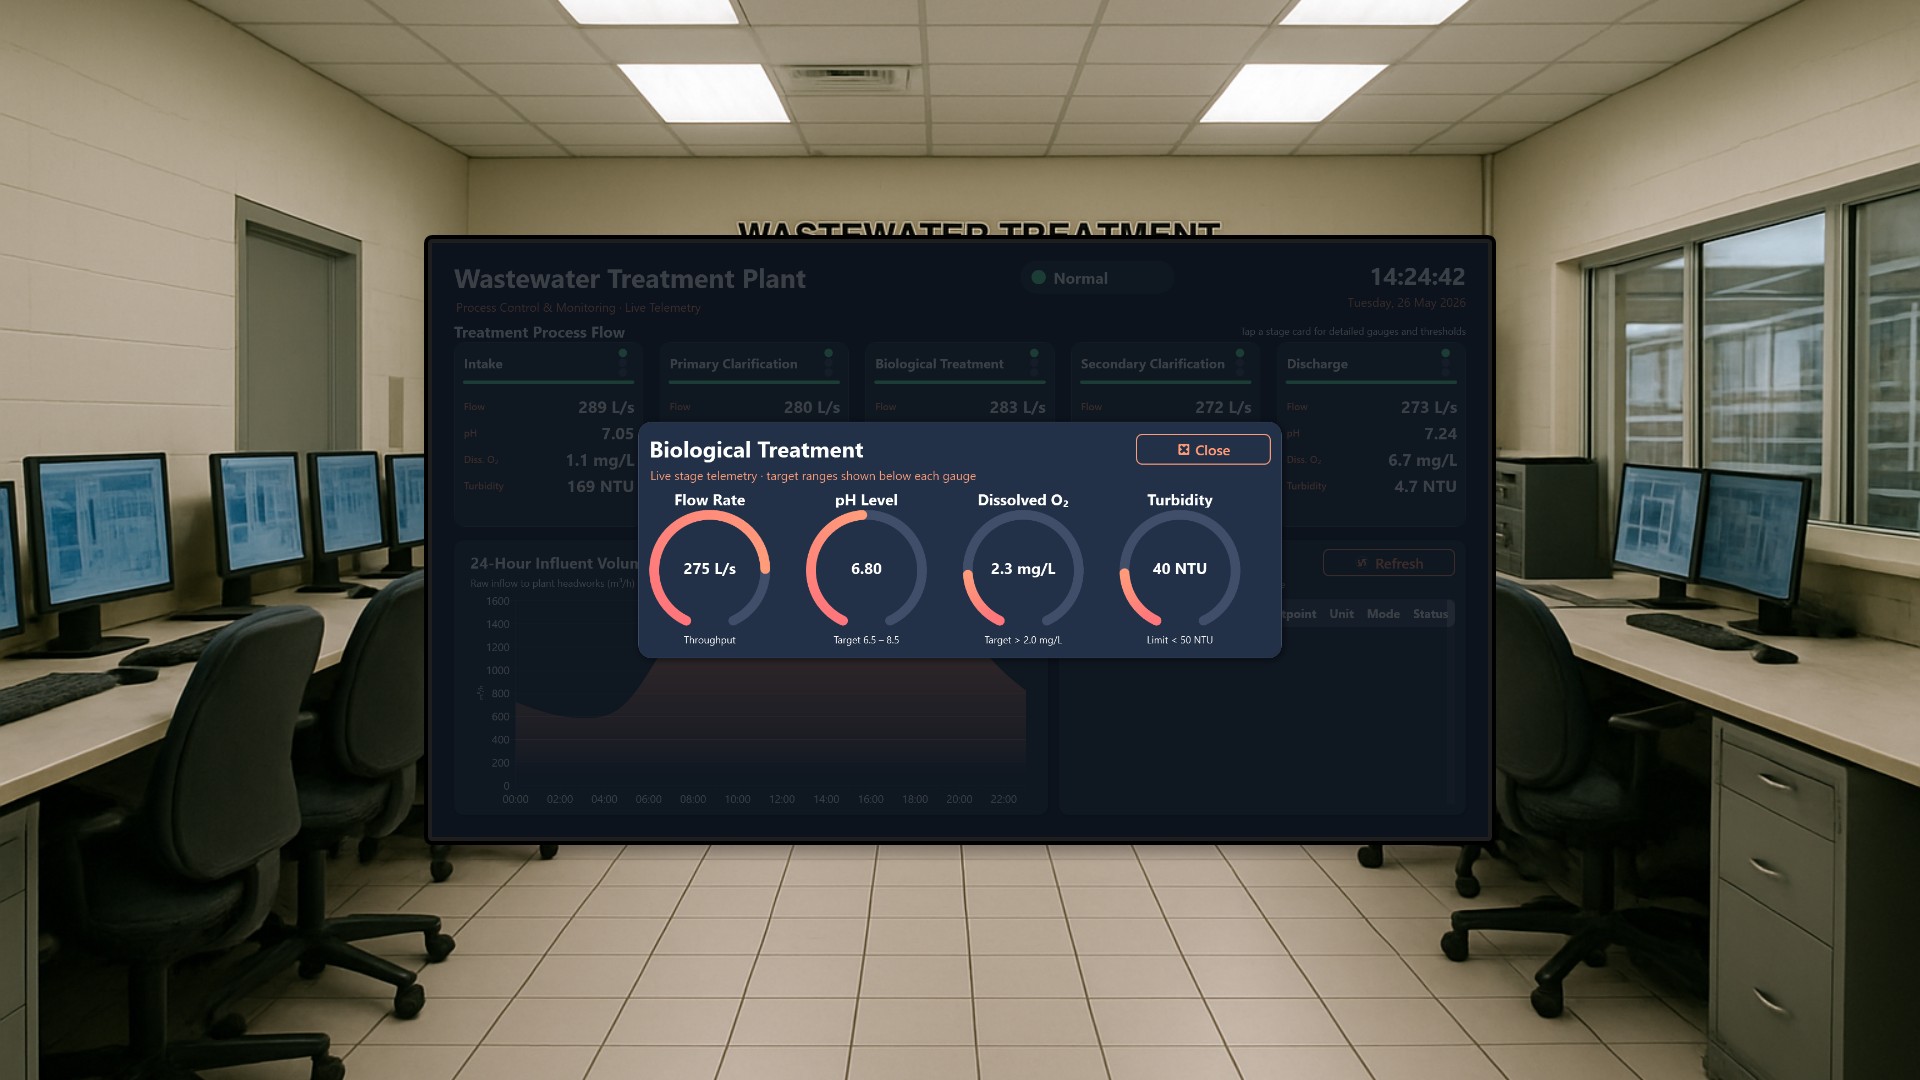
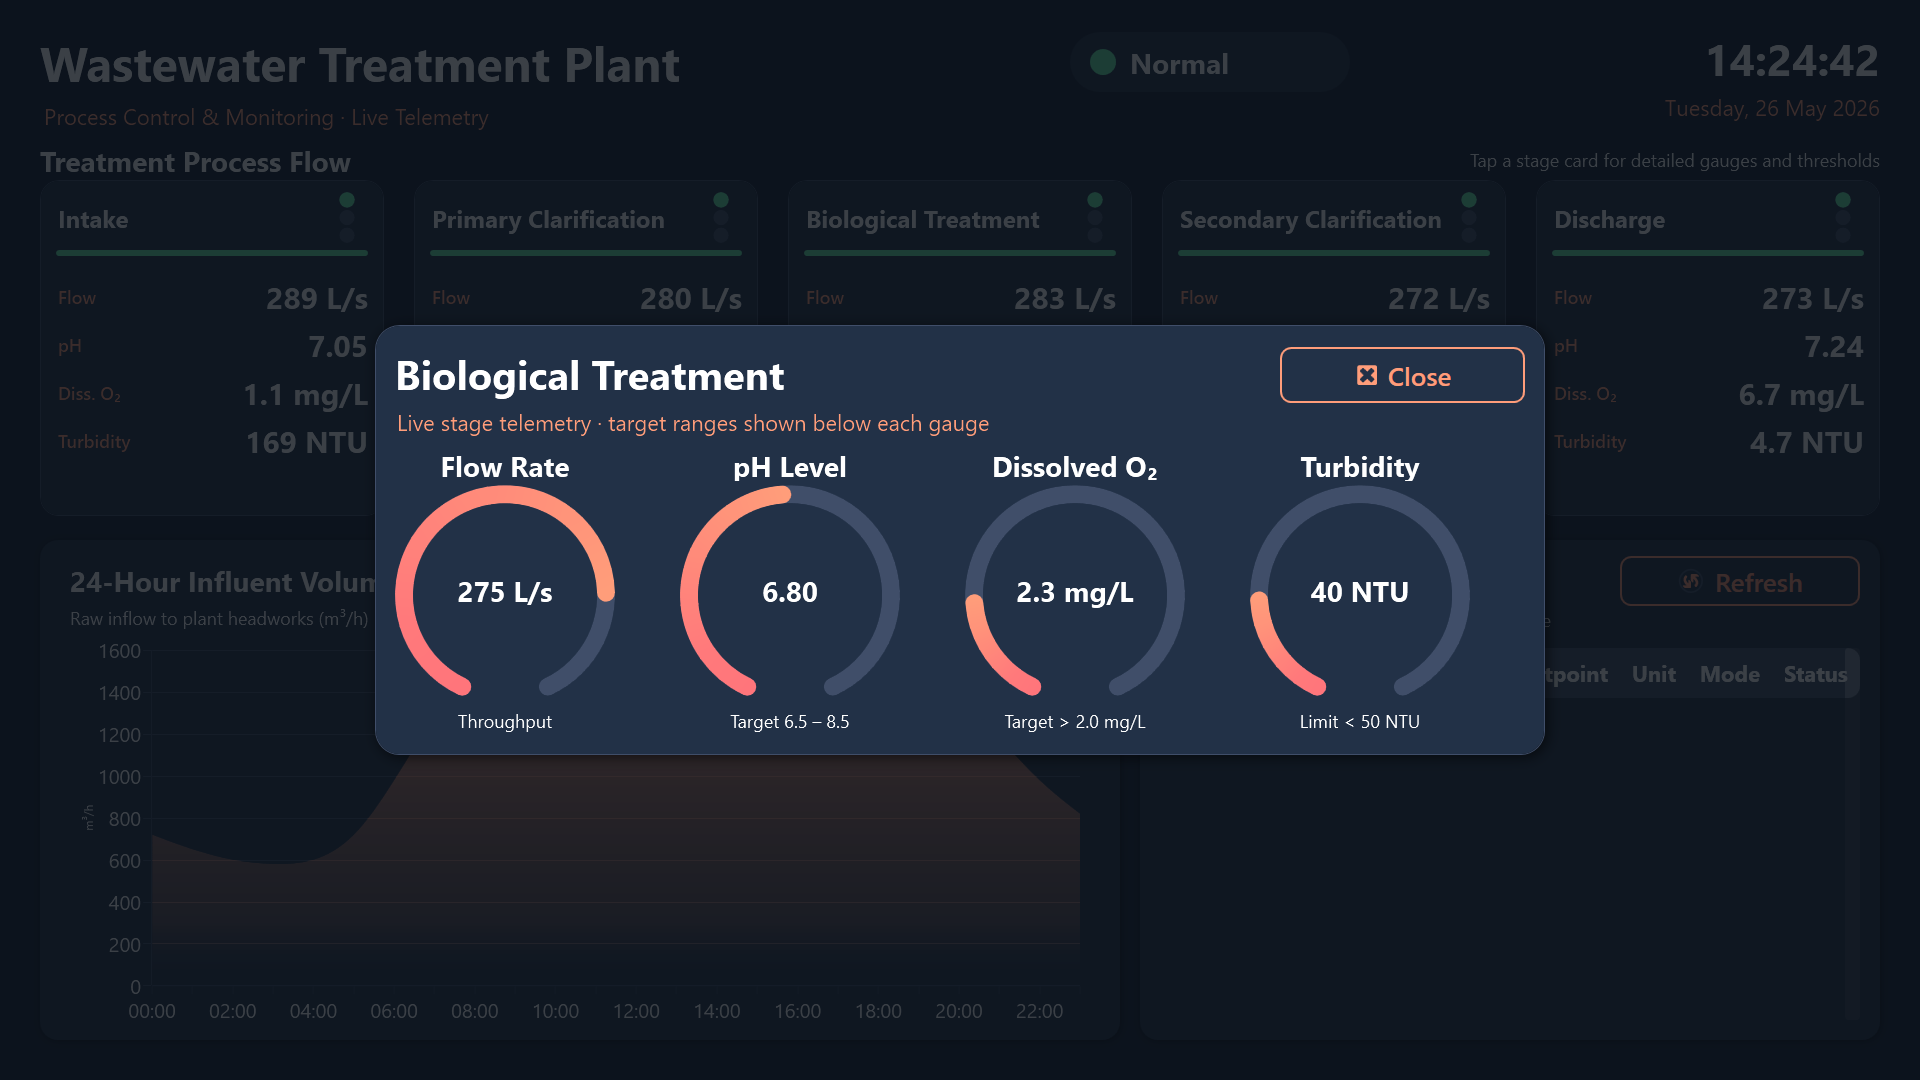
Drilling in without leaving the screen
Everything on the board is designed for a touch screen, and the real value shows up when an operator needs to investigate. Tapping any stage card opens a detail dialog with four large circular gauges, each annotated with its target range and colour-coded against thresholds. An operator who spots a Warning on the biological treatment card can drill straight into that stage, read the exact gauge values against their healthy bands, and decide what to do, all without walking away to a separate SCADA terminal.
The pump table is just as hands-on. Tapping a row opens a control dialog where the operator can dial in a new setpoint with a slider, nudge it up or down in fine increments, or jump to Min, 50%, or Max with a single tap. A dropdown switches the operating mode, and the change saves back to the shared pump list, or the operator can cancel out without committing anything. A Refresh button reloads the pump data and recomputes the live readings on demand. Both dialogs dim the background behind them, and tapping that dimmed backdrop dismisses the dialog, giving the screen the feel of a modern industrial HMI rather than a static sign.
Result
The finished dashboard turns a multi-stage process that is naturally spread out across a plant into one coherent, always-on picture. Operators see the overall status, the four key parameters at every stage, the day’s hydraulic profile, and the state of every dosing pump on a single screen, and they can drill into any stage or adjust any pump with a tap. Instead of stitching together readings from several panels to understand whether the plant is healthy, the shift gets the answer at a glance, and a developing problem is visible long before it becomes a permit violation.