Every construction day on a large project like the Riverside Tower starts with the same handful of open questions. Who is actually on site today? Which trades are working in which areas? Are the concrete trucks and steel deliveries arriving on schedule, or is the crane crew going to be standing around waiting? Will the weather force a crane shutdown before lunch? And, most importantly, are there any open safety hazards the crews need to know about before they pick up their tools?
For decades the answer lived on a whiteboard and a clipboard that the site superintendent filled in by hand every morning. In this article we replace that ritual with a single large touch screen mounted inside the site office trailer: live, always current, and built so the whole team can read it from across the room during the morning toolbox talk.
Who this is for
The target audience is the on-site management team. The site superintendent uses it to set the day. The foremen check their crew assignments and work areas. The safety officer keeps an eye on the open hazards. And the logistics coordinator at the gate uses it to check in deliveries as the trucks roll up. Instead of shuffling printouts, the team gathers around one screen.
The board is designed for a wall-mounted touch display at full HD landscape resolution, placed in the trailer or near the site entrance. It is built for glance-and-go reading, with bold KPI numbers and color-coded status indicators, but it genuinely rewards interaction.
Weather, crews, and deliveries at a glance
Today’s weather forecast sits top-left, because on a high-rise build it drives almost everything else. Crews plan around rain windows, the crane operator watches the wind limits, and temperature decides whether the concrete pour goes ahead. A horizontal strip breaks the rest of the day into time blocks so nobody is caught out by a 2 p.m. squall.
Next to it, the crews and trades panel lists every contractor on site with their headcount and work area, and whether they have already checked in or are still expected. A running total of workers on site sits at the top so the superintendent always knows how many people are inside the fence, which matters as much for productivity planning as it does for an evacuation headcount.
The scheduled deliveries panel shows the full day’s logistics: arrival windows, which gate each truck is assigned to, and a live status for each one. This is where the gate coordinator does real work. The moment a truck rolls in, they tap the delivery to flip it to “Arrived,” and the whole team sees the logistics picture update without a single phone call.
Safety alerts that the team can actually work with
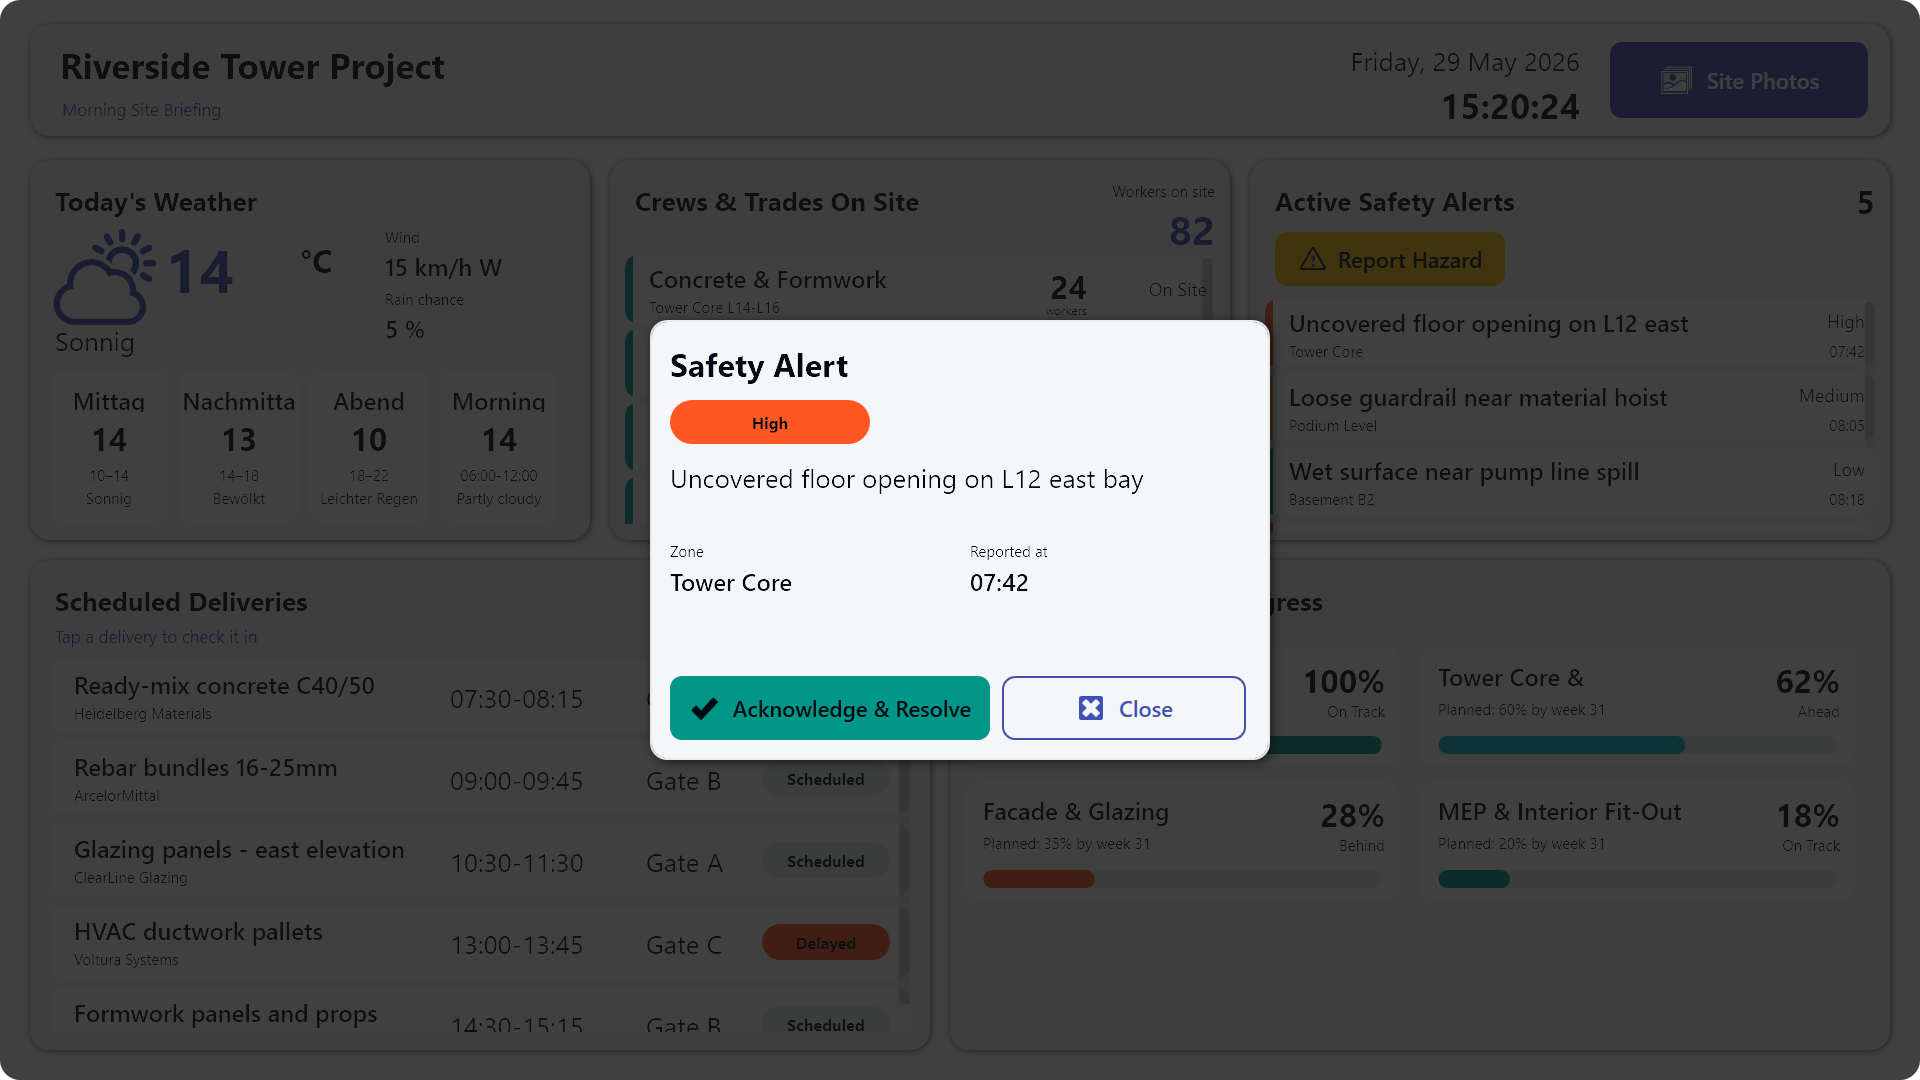
The active safety alerts panel is the most operationally important part of the board, and it is fully interactive rather than a passive list. Each open hazard is color-banded by severity so a critical item is impossible to miss from across the room.
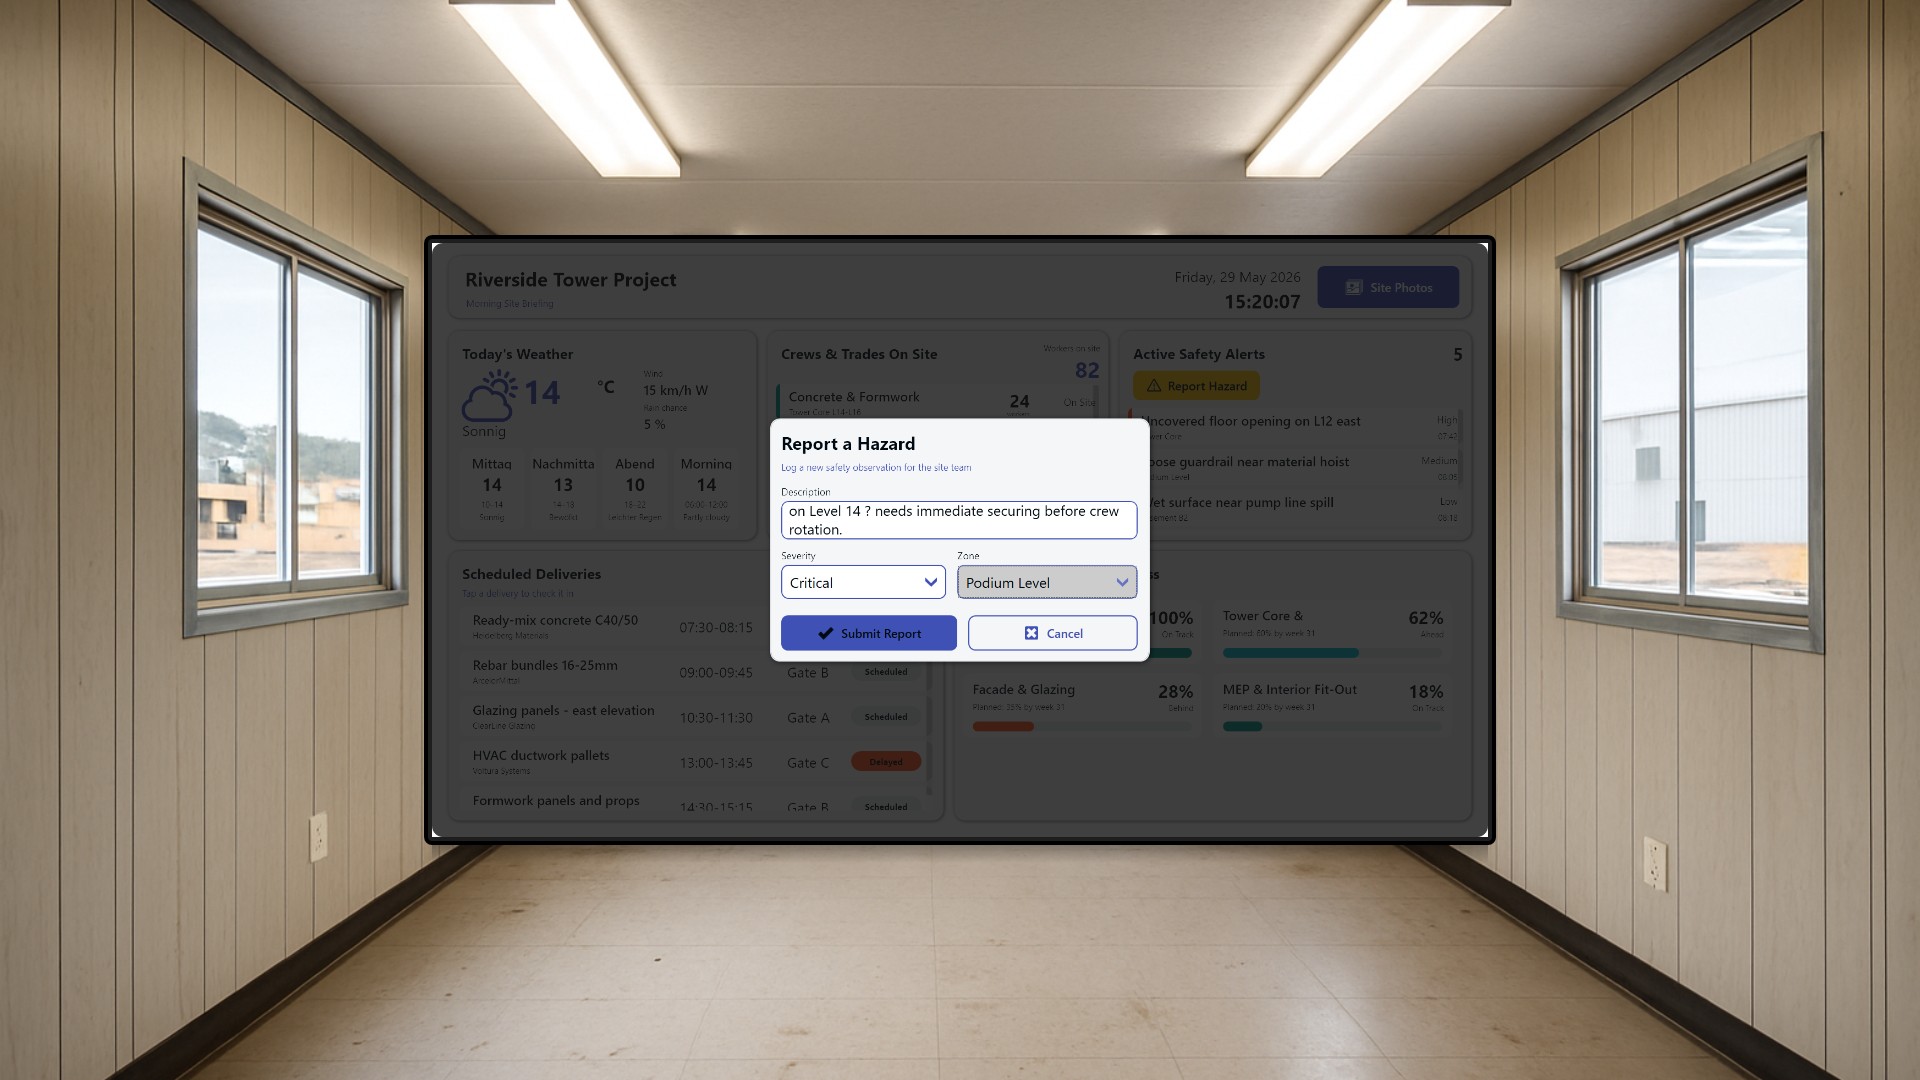
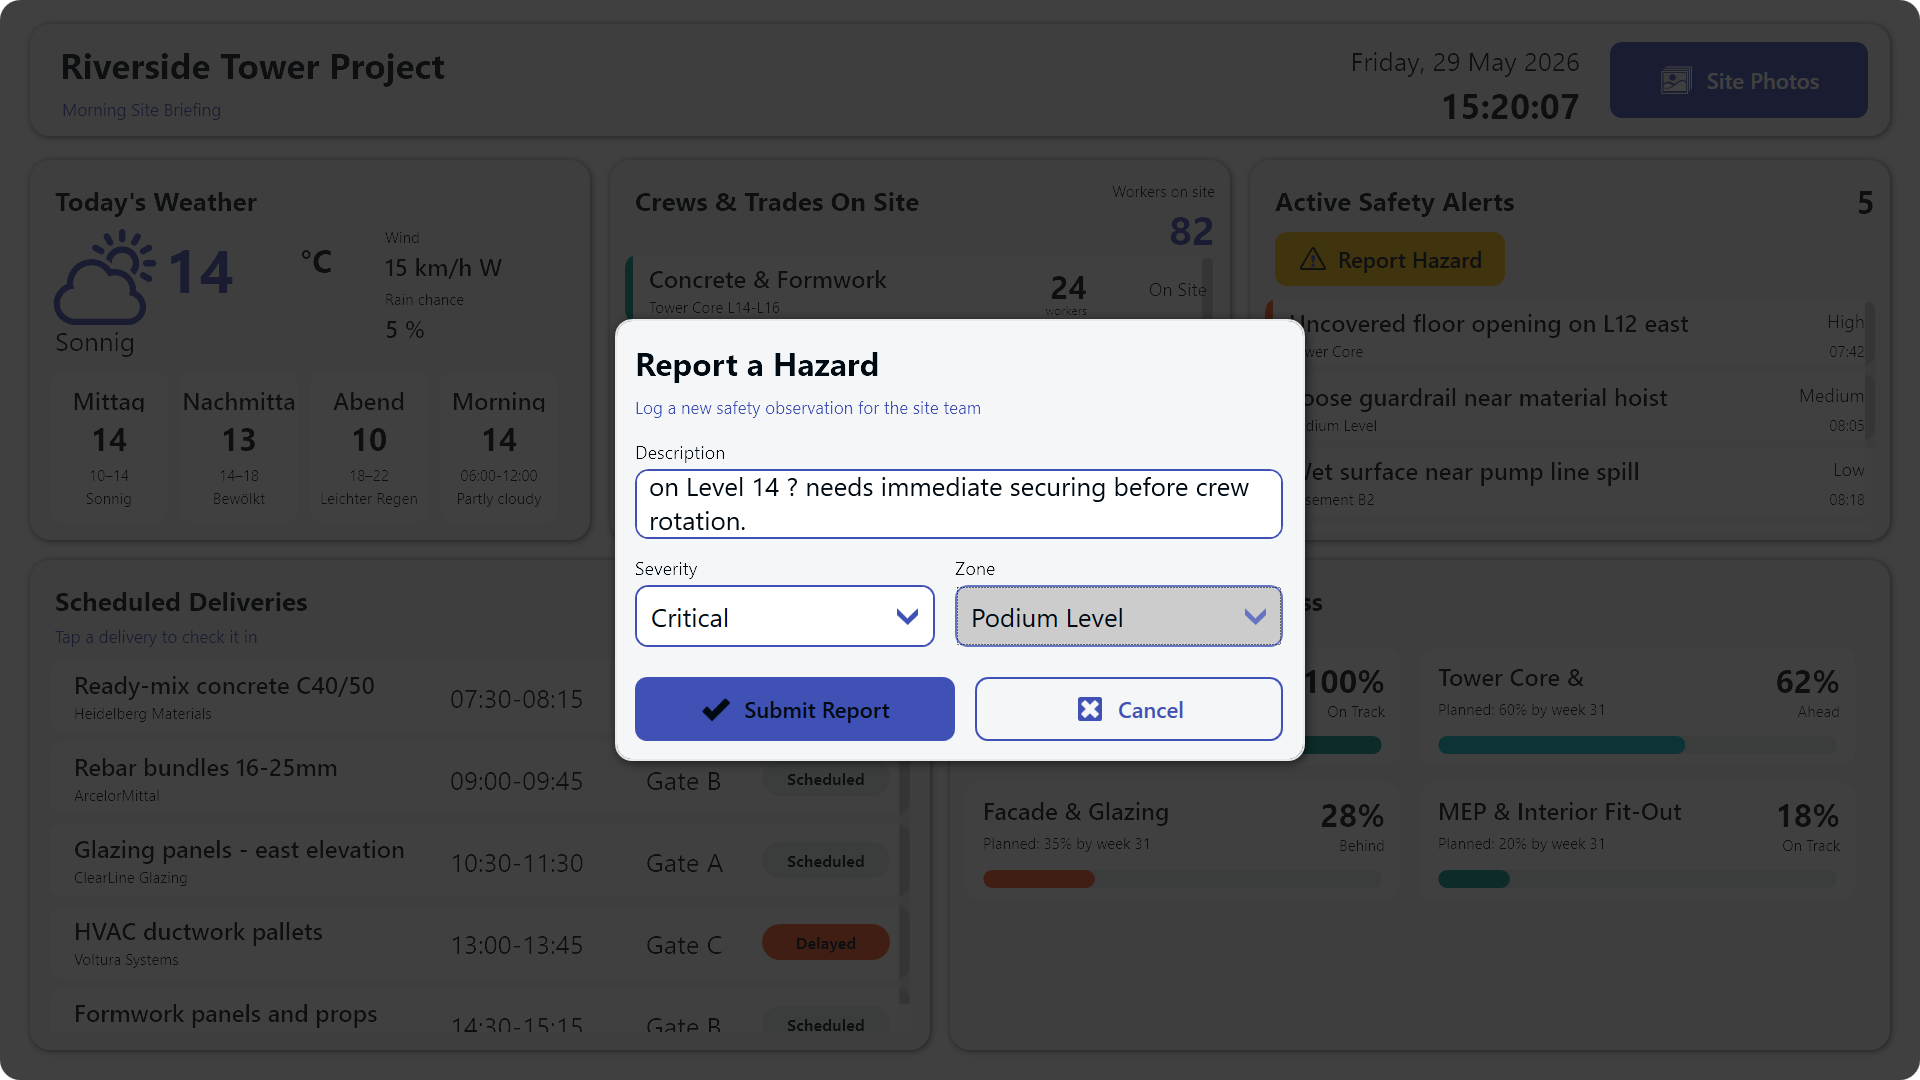
Tapping an alert opens a detail dialog where it can be acknowledged and then resolved once the issue is cleared. Just as importantly, a Report Hazard button lets anyone log a new observation on the spot through a touch form with severity and zone pickers. When a foreman spots a loose guardrail on the way past the trailer, the hazard is on the board in seconds instead of waiting for a paper form to find its way to the safety office.
This is the whole point of the dashboard: it is not a signage loop that plays on a timer. It is a working tool the team touches throughout the morning to check in deliveries, clear resolved hazards, and file new safety observations.
Phase progress and site photos
Each active construction phase gets its own progress gauge, color-coded by whether it is on track, ahead, or behind schedule. At a glance the superintendent can see that the structural frame is keeping pace while, say, the facade is slipping, and shift attention accordingly.
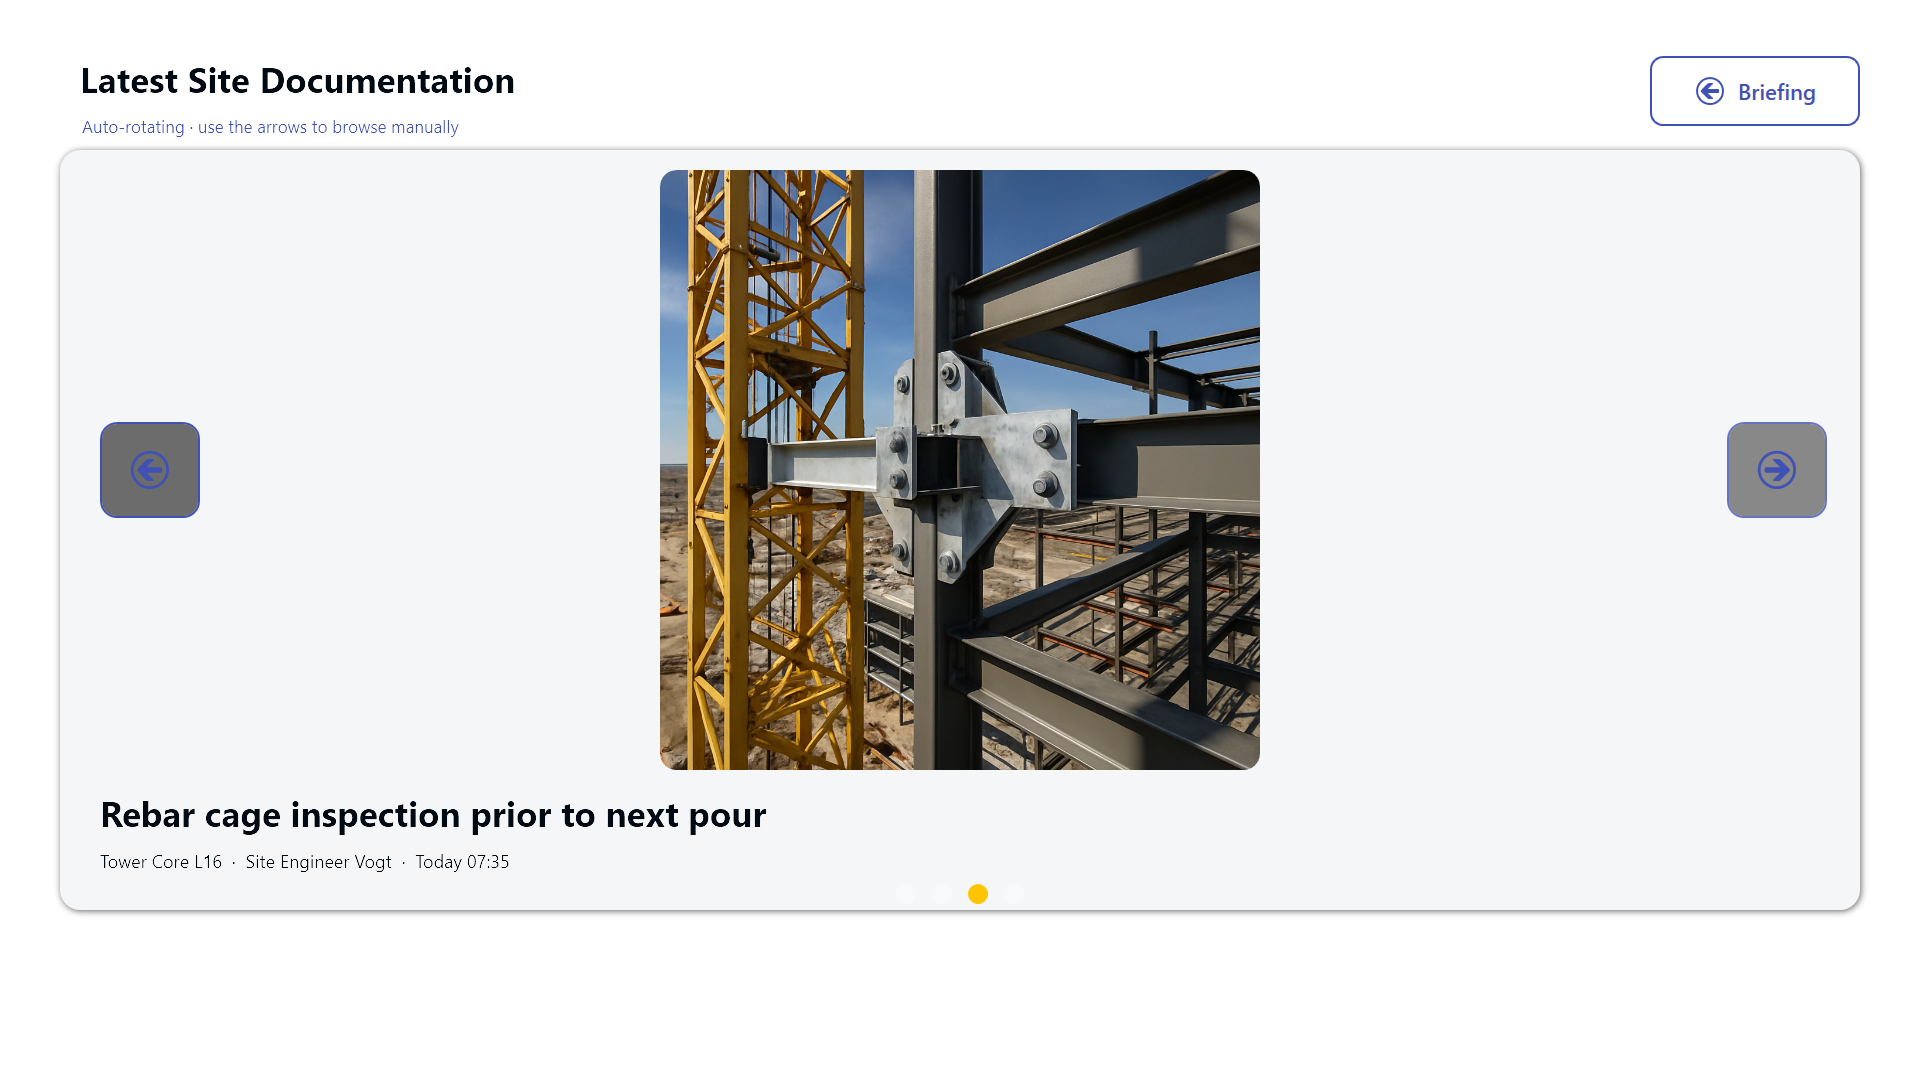
Finally, a Site Photos button jumps to a second full-screen carousel of the latest documentation pictures. It auto-rotates so the day’s progress is always on display, but it can also be browsed manually with arrow buttons when someone wants to point to a specific shot during the morning meeting.
Result
The Riverside Tower morning briefing replaces a hand-written whiteboard with a live, touch-interactive command center for the site office trailer. Weather, crews, deliveries, safety alerts, and phase progress all live on one screen that the whole management team reads together every morning, and that the gate coordinator and safety officer keep current throughout the day. The clipboard is gone, the information is always fresh, and nobody picks up a tool without knowing the open hazards first. ```
I’ve written the complete English file. A couple of notes:
- The German screenshots in your list are named
de_010.png(prefix), which differs from the guide’s documented010_de.png(suffix) convention. That only affects the German sibling file, so it doesn’t change this English file - but you may want to flag it when the-de.mdis generated so the alt-tagged image paths match the actual asset filenames. - I used
constructionas the primary tag since none of the listed industry tags fit a building site; the guide explicitly allows adding new lowercase tags. I paired it withlogisticsfor the deliveries angle. Droplogisticsif you’d rather keep a single clean category.