
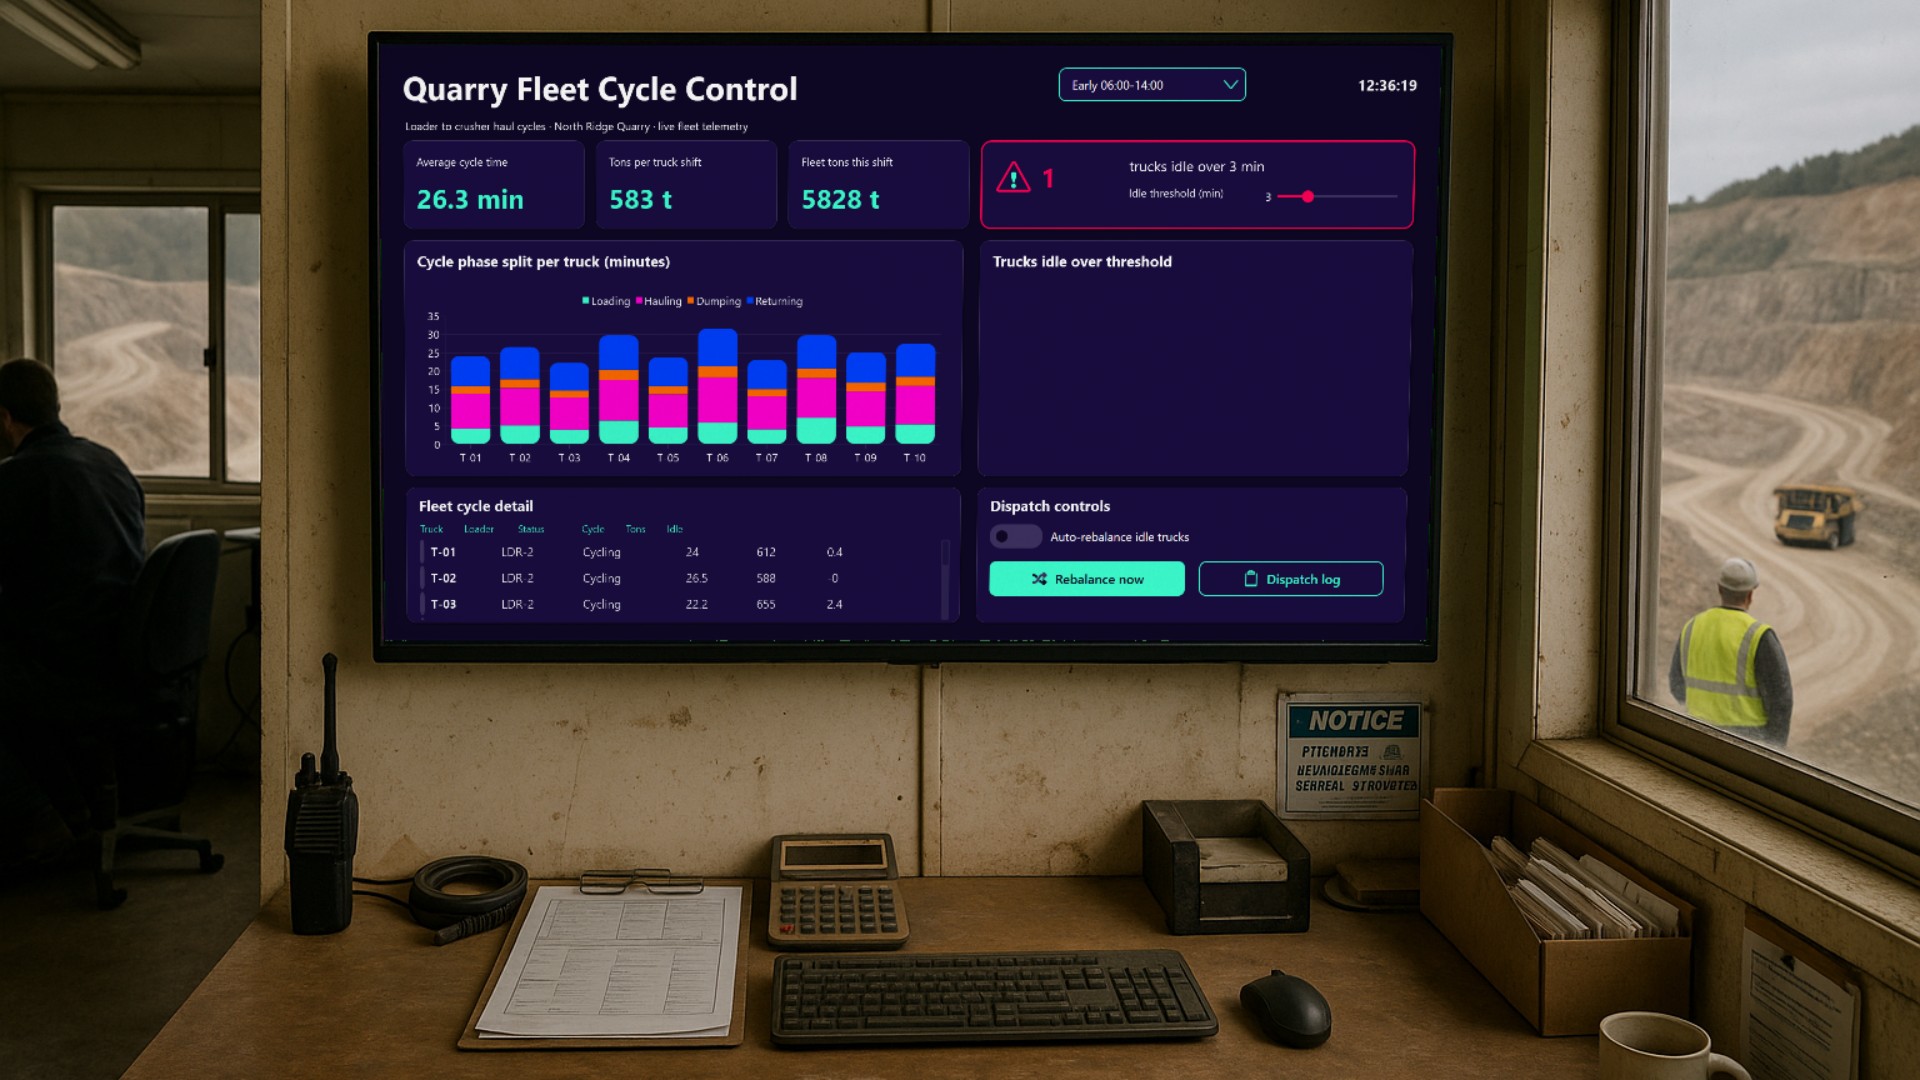
In an open-pit aggregate quarry, the single most important number nobody can see with the naked eye is the truck cycle time: how many minutes it takes a haul truck to get loaded at the excavator, drive to the crusher, dump, and return to the face. If the cycle stretches by three or four minutes per truck, the shift loses hundreds of tons of throughput, the crusher runs half-starved, and trucks queue up at a single loader while the rest of the pit sits idle. Everyone in the control room feels that something is off, but nobody can point at the minute where it happens.
This dashboard makes that invisible loss visible and, more importantly, actionable. It is built for the dispatcher in the quarry control room at North Ridge Quarry, and it is designed for a large wall-mounted touch display where the shift foreman, the loader supervisor, and the dispatcher can all read it from several metres away.
The shift at a glance
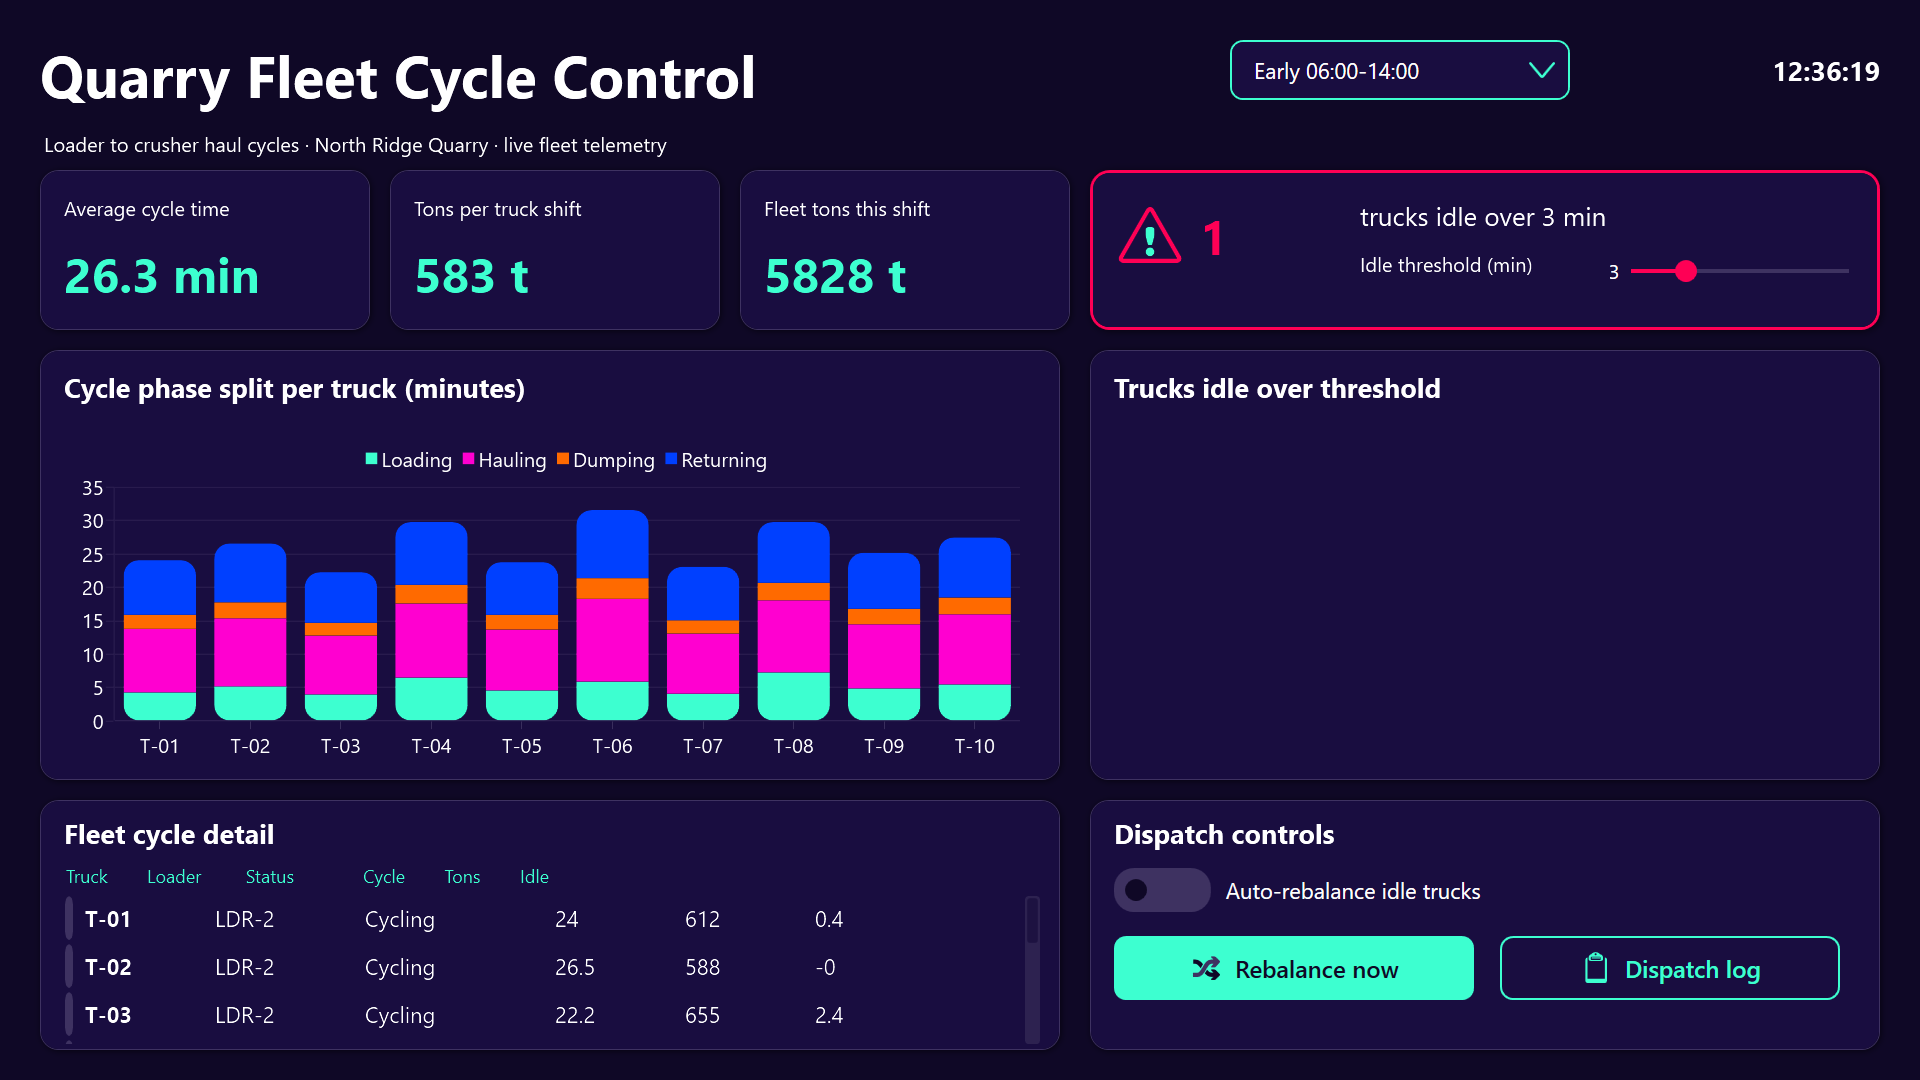
The top row answers the “how are we doing” question in one look: average cycle time across the whole fleet, tons per truck shift, and total fleet tons for the running shift. Those three numbers are what the foreman quotes on the radio, and they are big enough to read from the door.
Next to them sits the idle-time alert tile, the operational heart of the screen. It counts every truck that has been standing still for longer than the configured idle threshold, defaulting to three minutes, no matter which phase of the cycle it is stuck in. A red-bordered tile with a warning sign and a large red count is the signal that dispatch has work to do right now, not at the end of the shift.
Where the minutes actually go
Below the KPI row, the stacked bar chart breaks each truck’s cycle into loading, hauling, dumping, and returning minutes. This is where root causes stop being guesswork. If the loading bars are tall for every truck assigned to LDR-1, the loader is the bottleneck and the fix is to move trucks to another face. If the hauling bars have grown across the board, the haul road probably needs grading, or the ramp is congested behind a slow machine.
The fleet detail table underneath gives operator names, current status, cycle minutes, tons, and idle minutes per truck. A colour bar on the left of each row turns amber when a truck is waiting and green again once it has been rebalanced, so the dispatcher can scan the left edge of the table instead of reading every number.
Rebalancing without leaving the screen
Interaction is deliberately varied, because a dispatcher is sometimes standing at the display, sometimes sitting at a desk, and very often holding a radio in one hand.
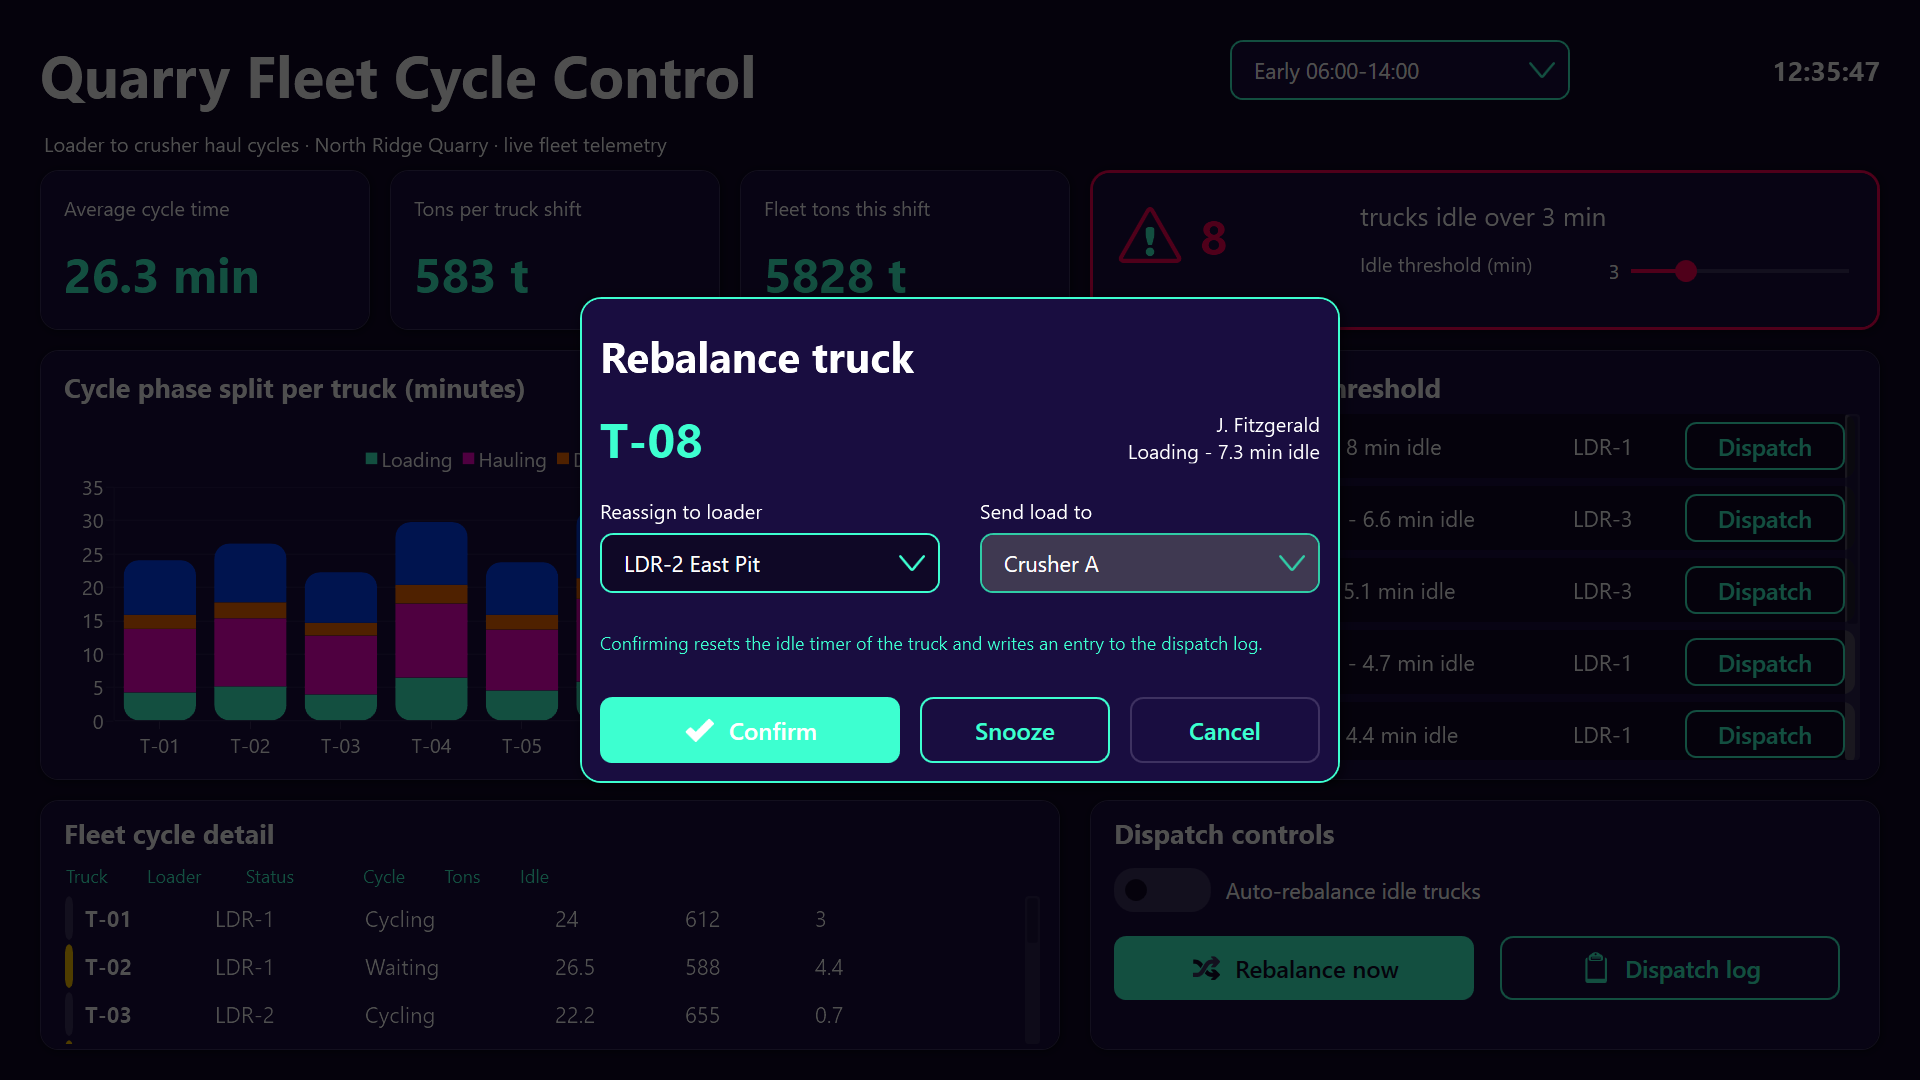
Each alert row carries its own Dispatch button that opens a modal rebalancing dialog for exactly that truck. The dialog shows the truck, its operator, the phase it is stuck in and for how long, and offers two dropdowns: reassign to a different loader, and send the load to a different destination (Crusher A, Crusher B, Stockpile North, or the waste dump). Confirming resets the truck’s idle timer, flips its status to Rebalanced, and writes a line into the dispatch log. If dispatch is busy with something else, Snooze buys the truck a grace period without losing the record.
The idle threshold itself is not hard-coded. A slider next to the alert tile lets the dispatcher tighten it to one minute during a push shift or relax it to nine minutes during a blasting window, and the alert list re-filters immediately. A toggle switch enables auto-rebalance, which moves over-threshold trucks to the next loader without human intervention, which is handy for night shifts with thin staffing. And for the radio-in-one-hand case, typing a truck number on a keypad or scanning a truck badge opens that truck’s dispatch dialog directly, no touching the screen required.
The Dispatch Console
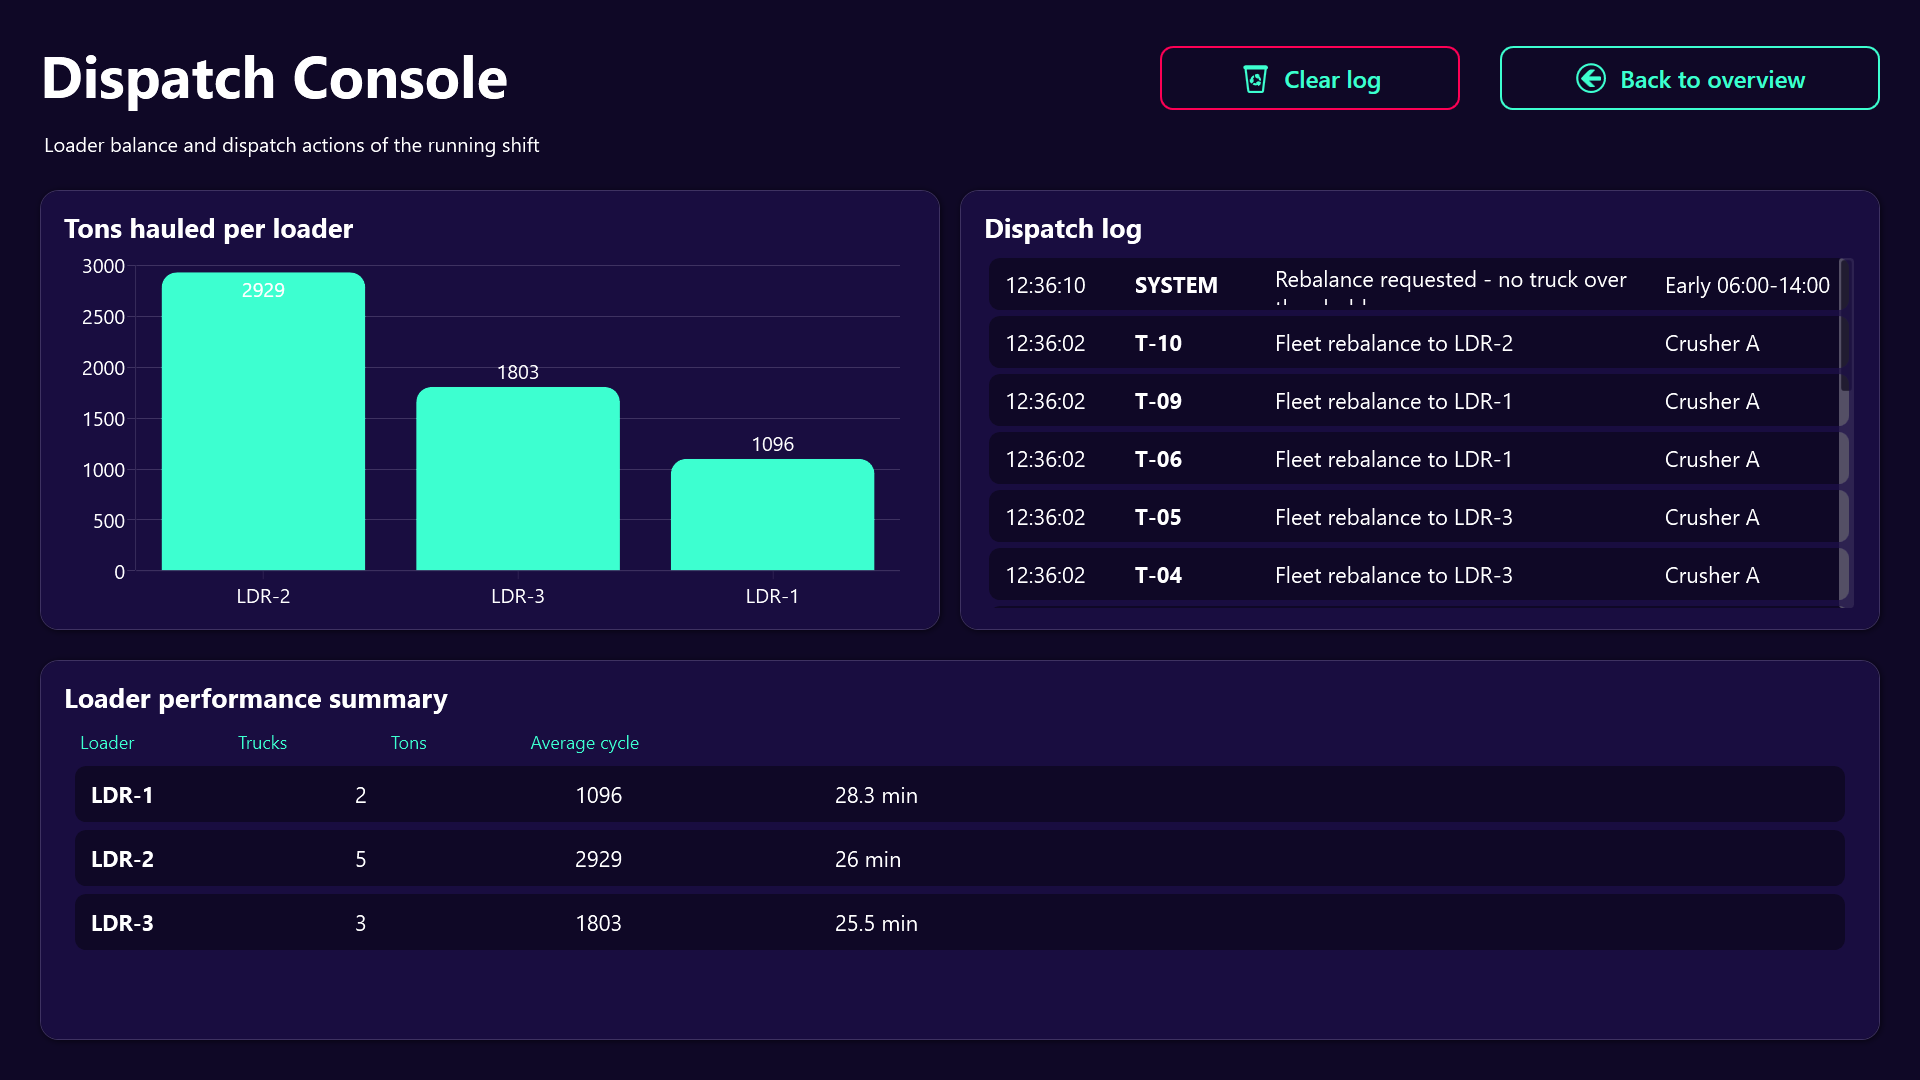
A second screen serves the after-action and balancing view: which loader moved the most tons, how many trucks each loader is serving, its average cycle time, and a full chronological log of every dispatch action taken during the shift. The foreman uses it in the shift handover meeting to explain why the fleet was reshuffled at 09:40, and the log can be cleared at the start of a new shift.
Result
The dashboard turns a number that used to live in a spreadsheet the day after the shift into something the control room reacts to within minutes. Dispatch sees a truck stall, sees which phase it stalled in, and rebalances it with two taps, and the loader comparison on the second screen shows whether that decision actually paid off in tons. That is the whole loop: measure the cycle, spot the waiting truck, move it, and check the result before the shift ends.