Commercial greenhouse operations have a recurring problem: the people who can see the plants are not the people who decide when to escalate, and the people who decide cannot smell, touch, or hear what is actually happening between the rows. The result is either over-alerting (every spike triggers a phone call) or under-acknowledgement (alarms sit on a screen no one is watching while a critical zone bakes for two hours). The two dashboards in this suite are designed to close that loop with a single shared data backbone, so an action taken in the office is immediately reflected on the floor, and a manual check performed on the floor is logged where the office can see it.
The Greenhouse Floor Dashboard
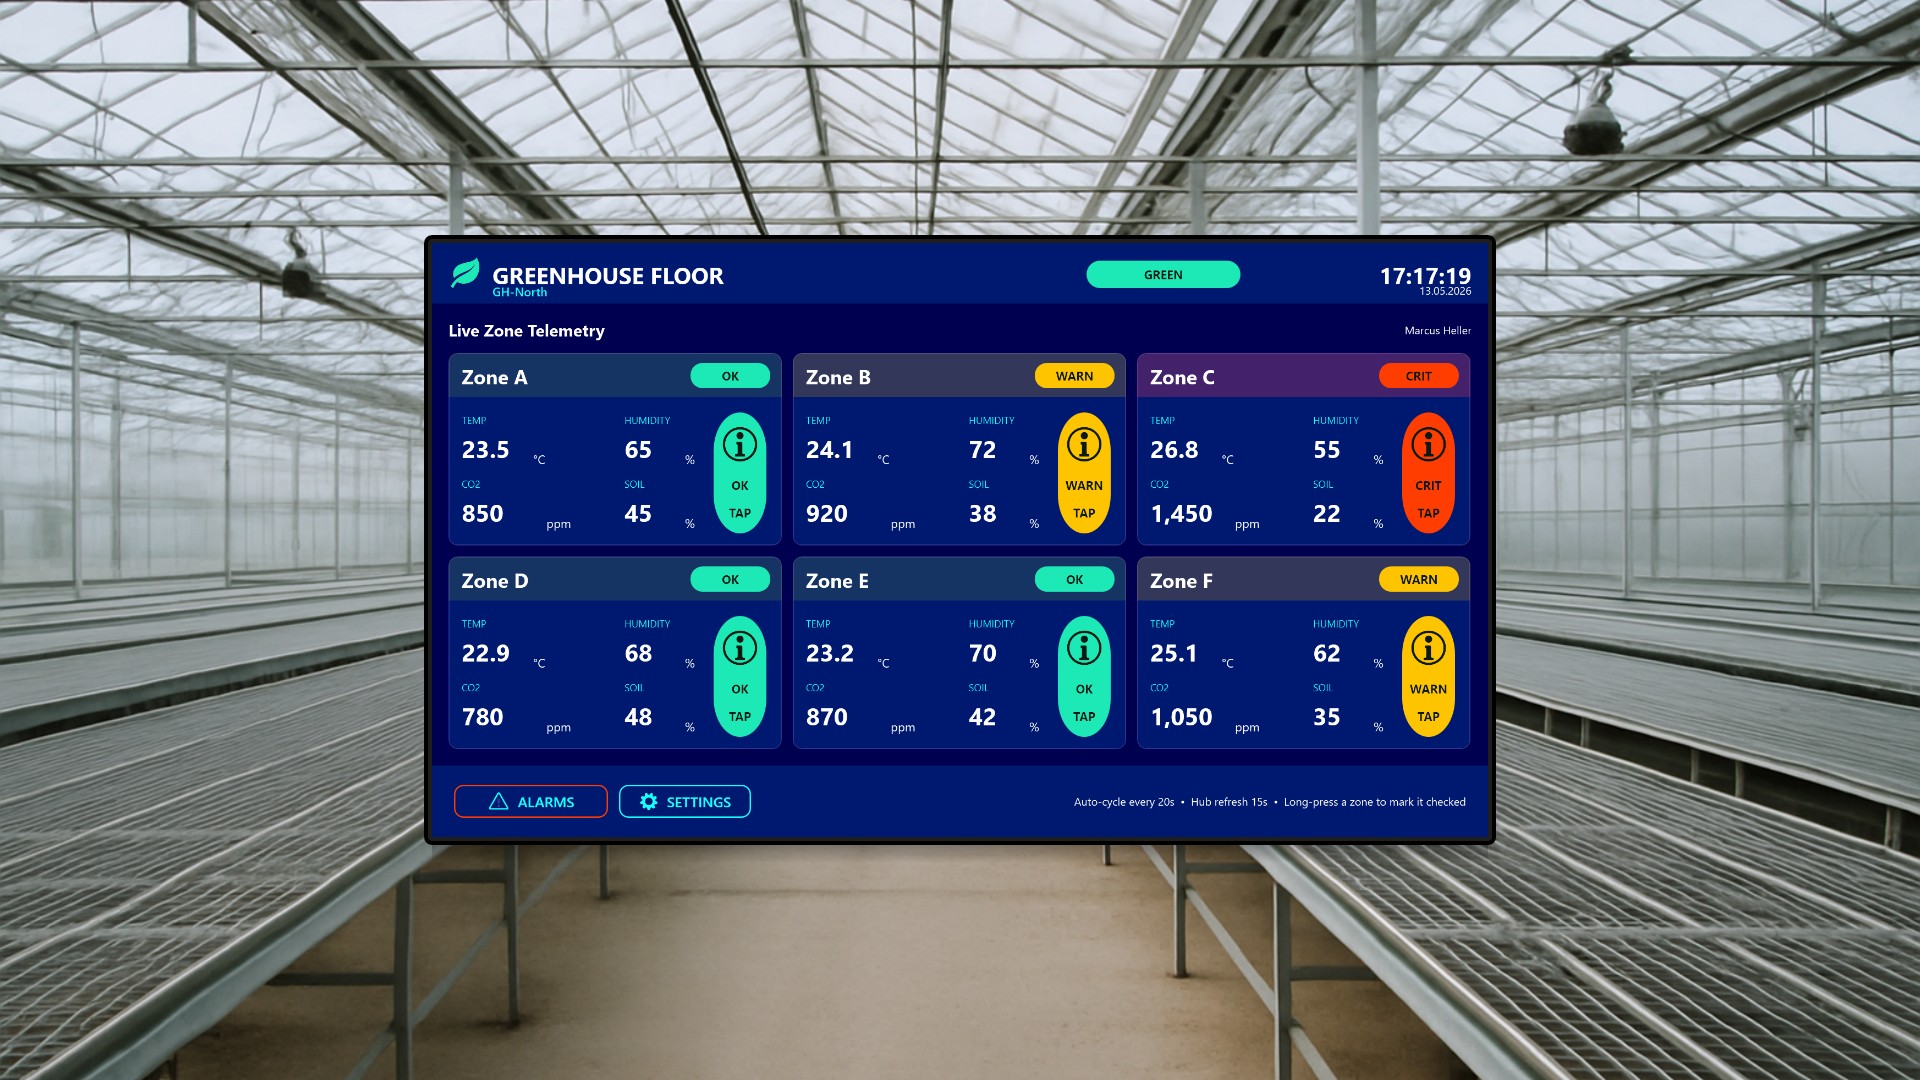
The first application is built for a wall-mounted touch screen inside the growing area itself. Picture a ruggedized 1920x1080 panel bolted to a support column near the main aisle of a tomato block, visible from anywhere in the rows. The crew passing by gets an immediate, glanceable read of every cultivation zone in that house: temperature in degrees Celsius, relative humidity, CO2 concentration in ppm, and volumetric soil moisture, each presented in a six-up tile grid with a traffic-light color band (green for OK, amber for WARN, red for CRIT) and a status pill.
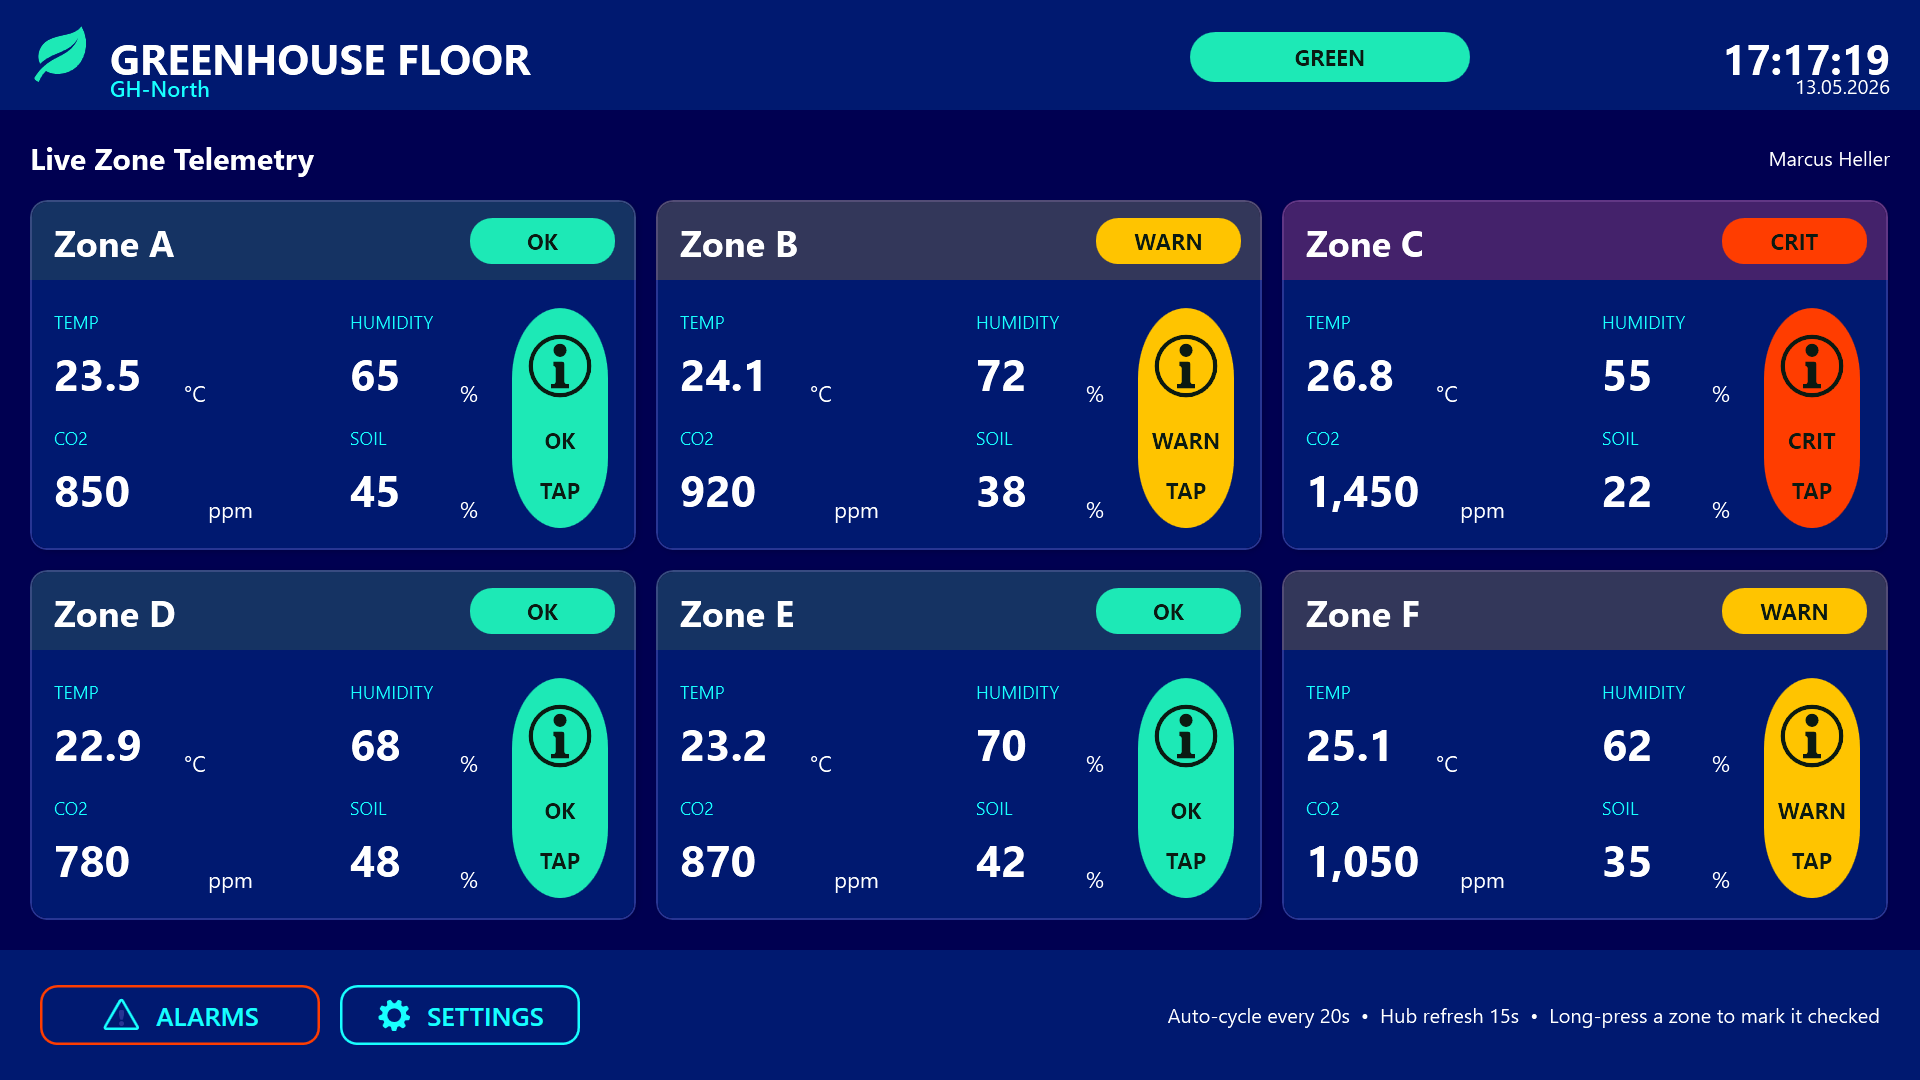
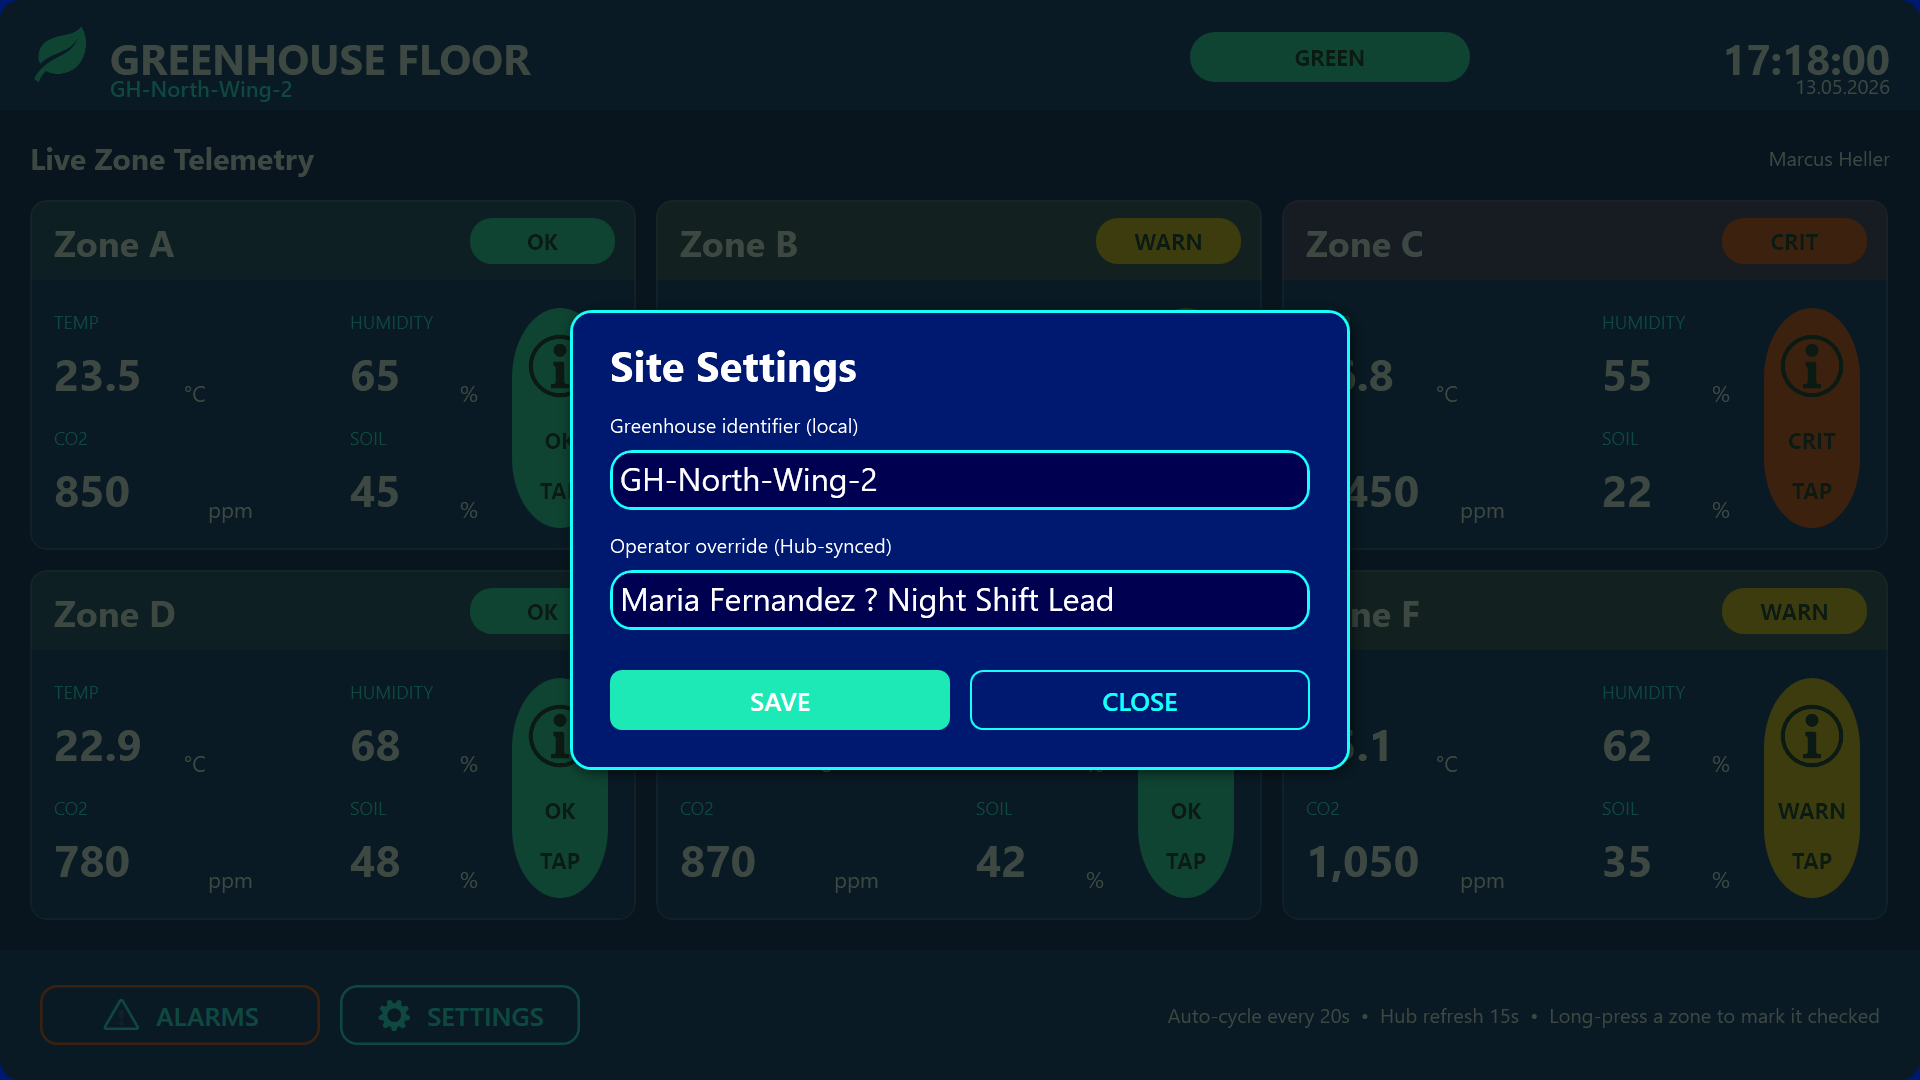
The header carries a site-status badge that rolls up the worst zone status across the whole property (pushed down from the office), today’s date and clock, and the name of the operator currently on duty.
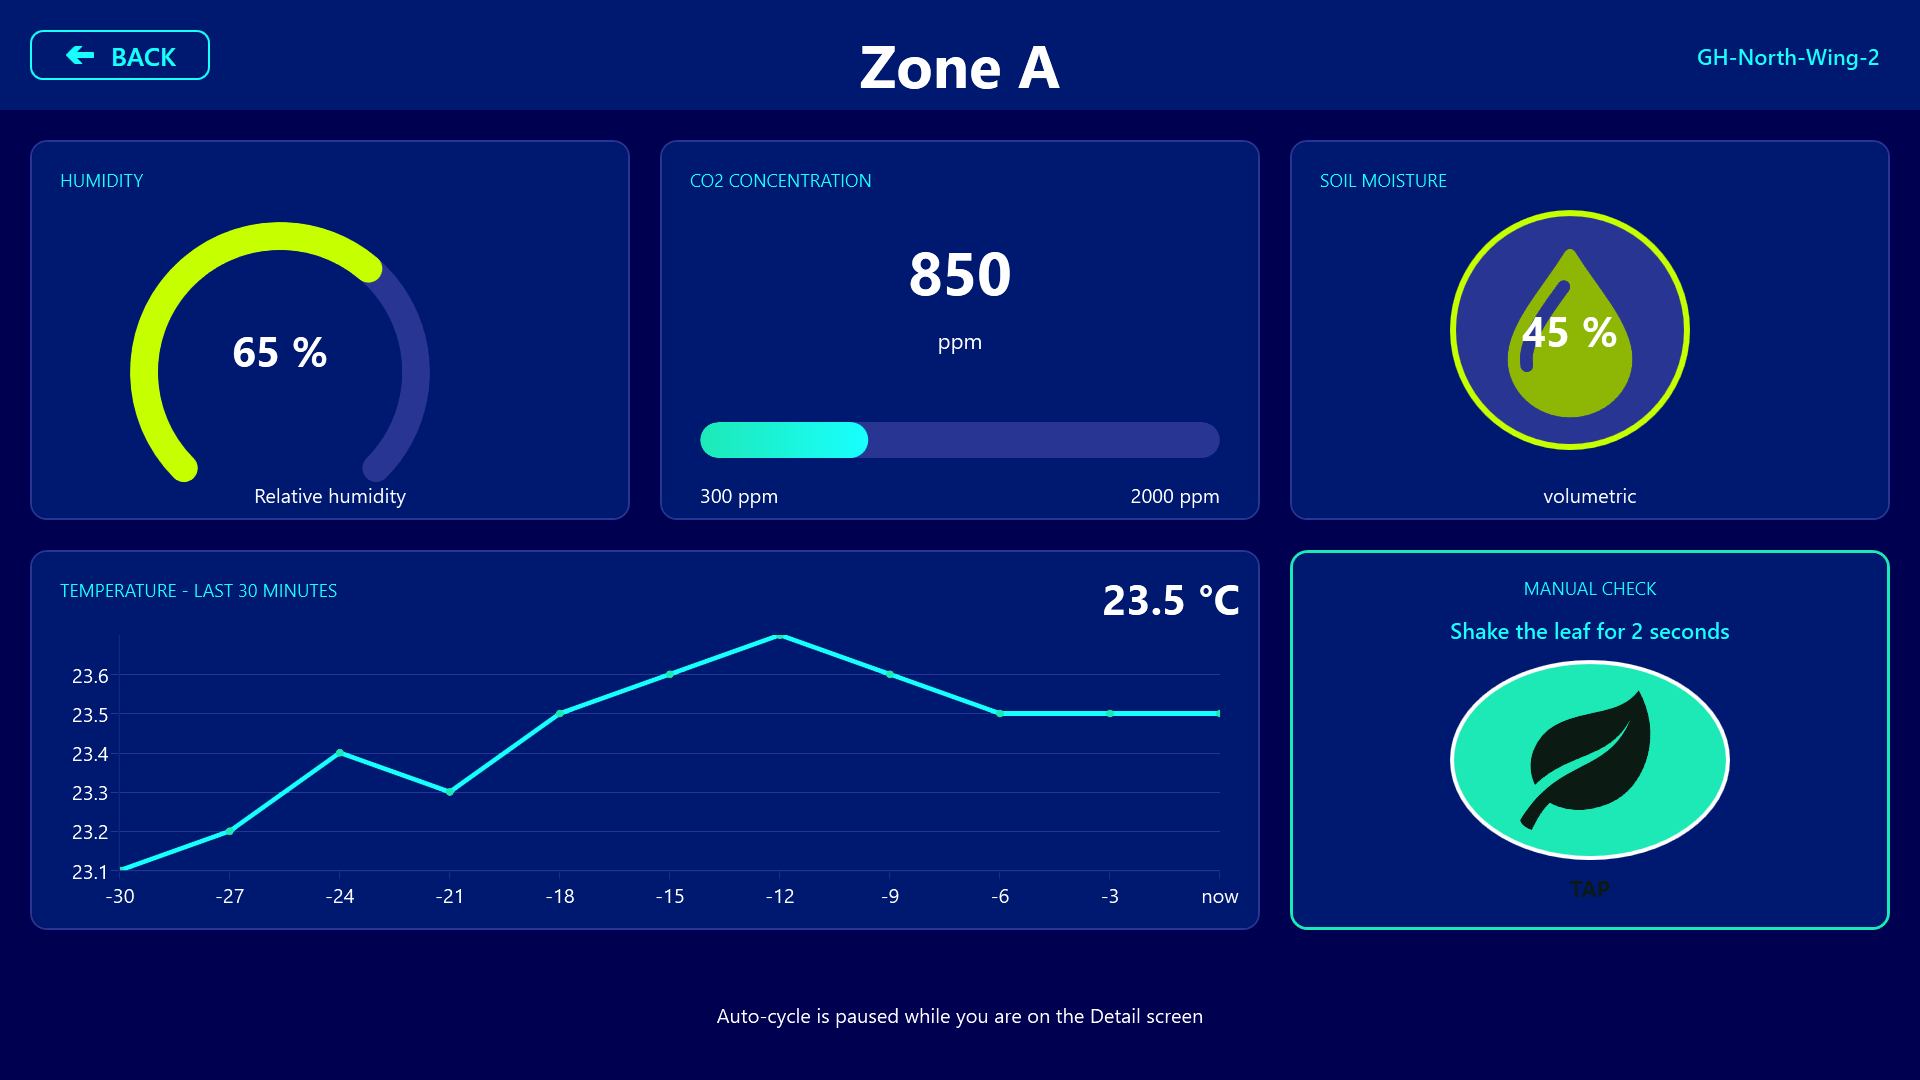
Tapping any zone tile drills into a detail screen with a humidity dial, a CO2 bar gauge with target band, an animated soil-moisture indicator, and a thirty-minute temperature sparkline. The same detail screen carries a unique manual-check confirmation gesture: instead of a plain “I checked this zone” button, the worker taps a green leaf, then holds it steady for two seconds while a progress bar fills and a countdown ticks down. This deliberate pause prevents accidental check-ins and writes a row to a shared check log that the office can audit later.
A third screen lists active, unacknowledged alarms in the local house, and the footer carries a one-line reminder that acknowledgement is performed by the office, not here on the floor.
The Greenhouse Operations Center
The second application is for a desktop or wall display in the office or control room and gives the supervisor a property-wide map view. A stylized map panel on the left shows four greenhouses (GH-North, GH-South, GH-East, GH-West) as labeled tiles arranged geographically, each painted orange by default but flashing red when their per-greenhouse unacknowledged-alarm count rises above zero. A cyan badge on each tile shows the live count.
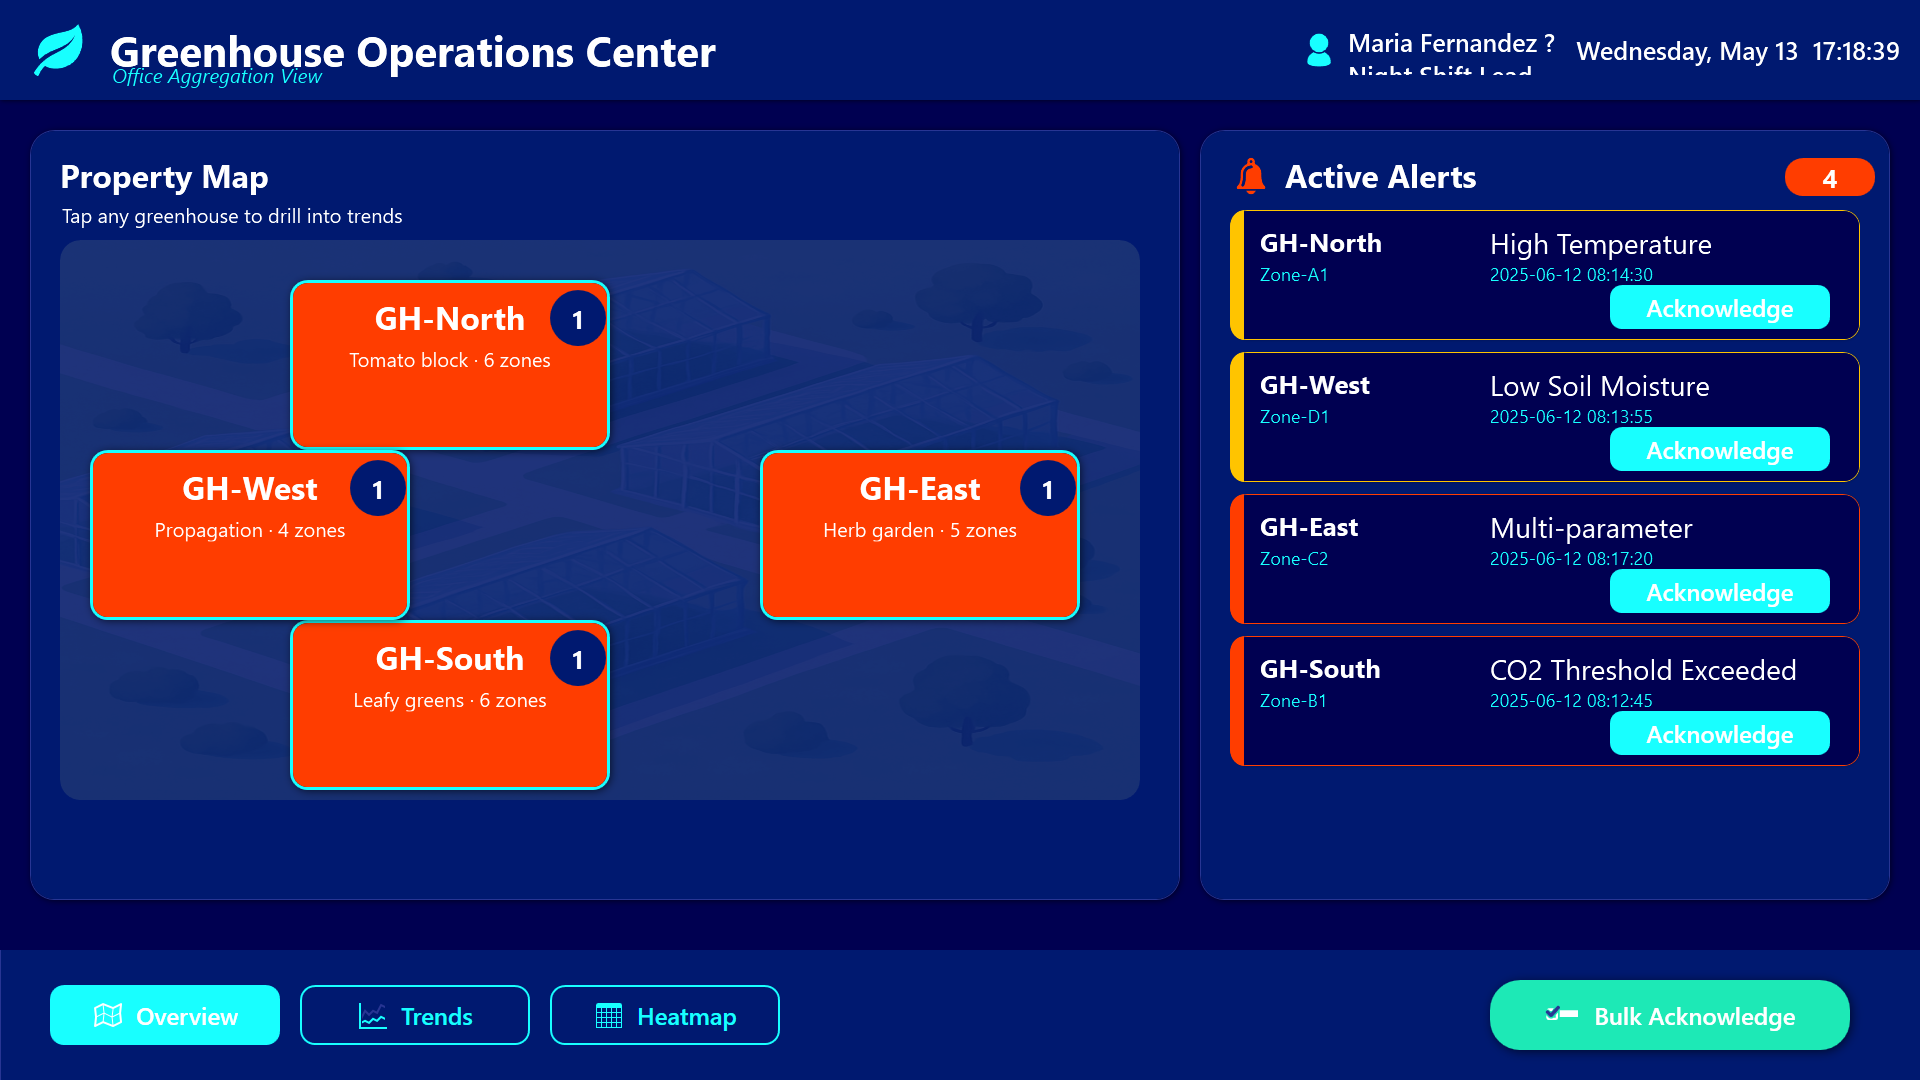
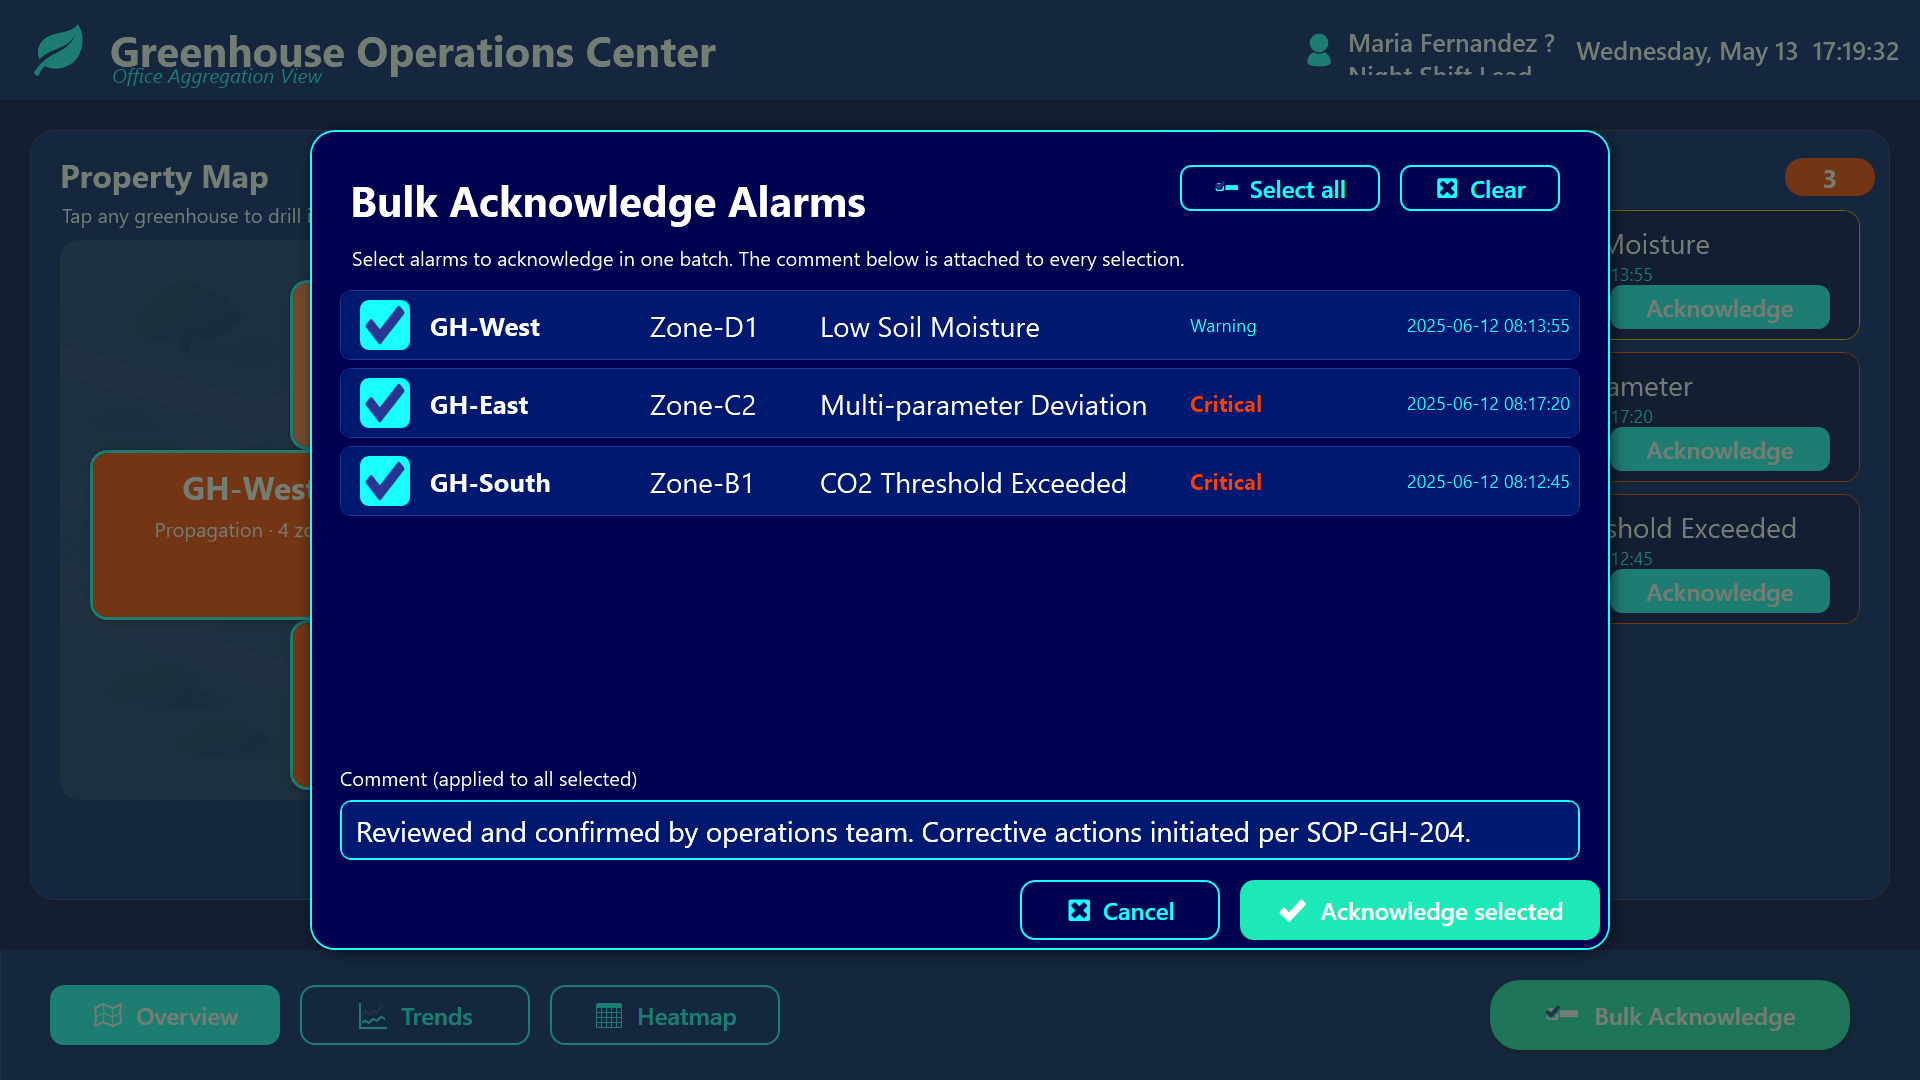
The right side of the overview is a live alert feed driven by the shared zone-readings list, filtered to only active, unacknowledged alarms across the entire property, sorted by severity, with a colored severity stripe and an inline Acknowledge button on every row. The big call-to-action at the bottom is a teal Bulk Acknowledge button that opens a full-screen modal: a checkbox list of every active alarm, Select All / Clear shortcuts, a comment field that is attached to every selected row, and a single confirm that writes the acknowledgement back to the shared list.
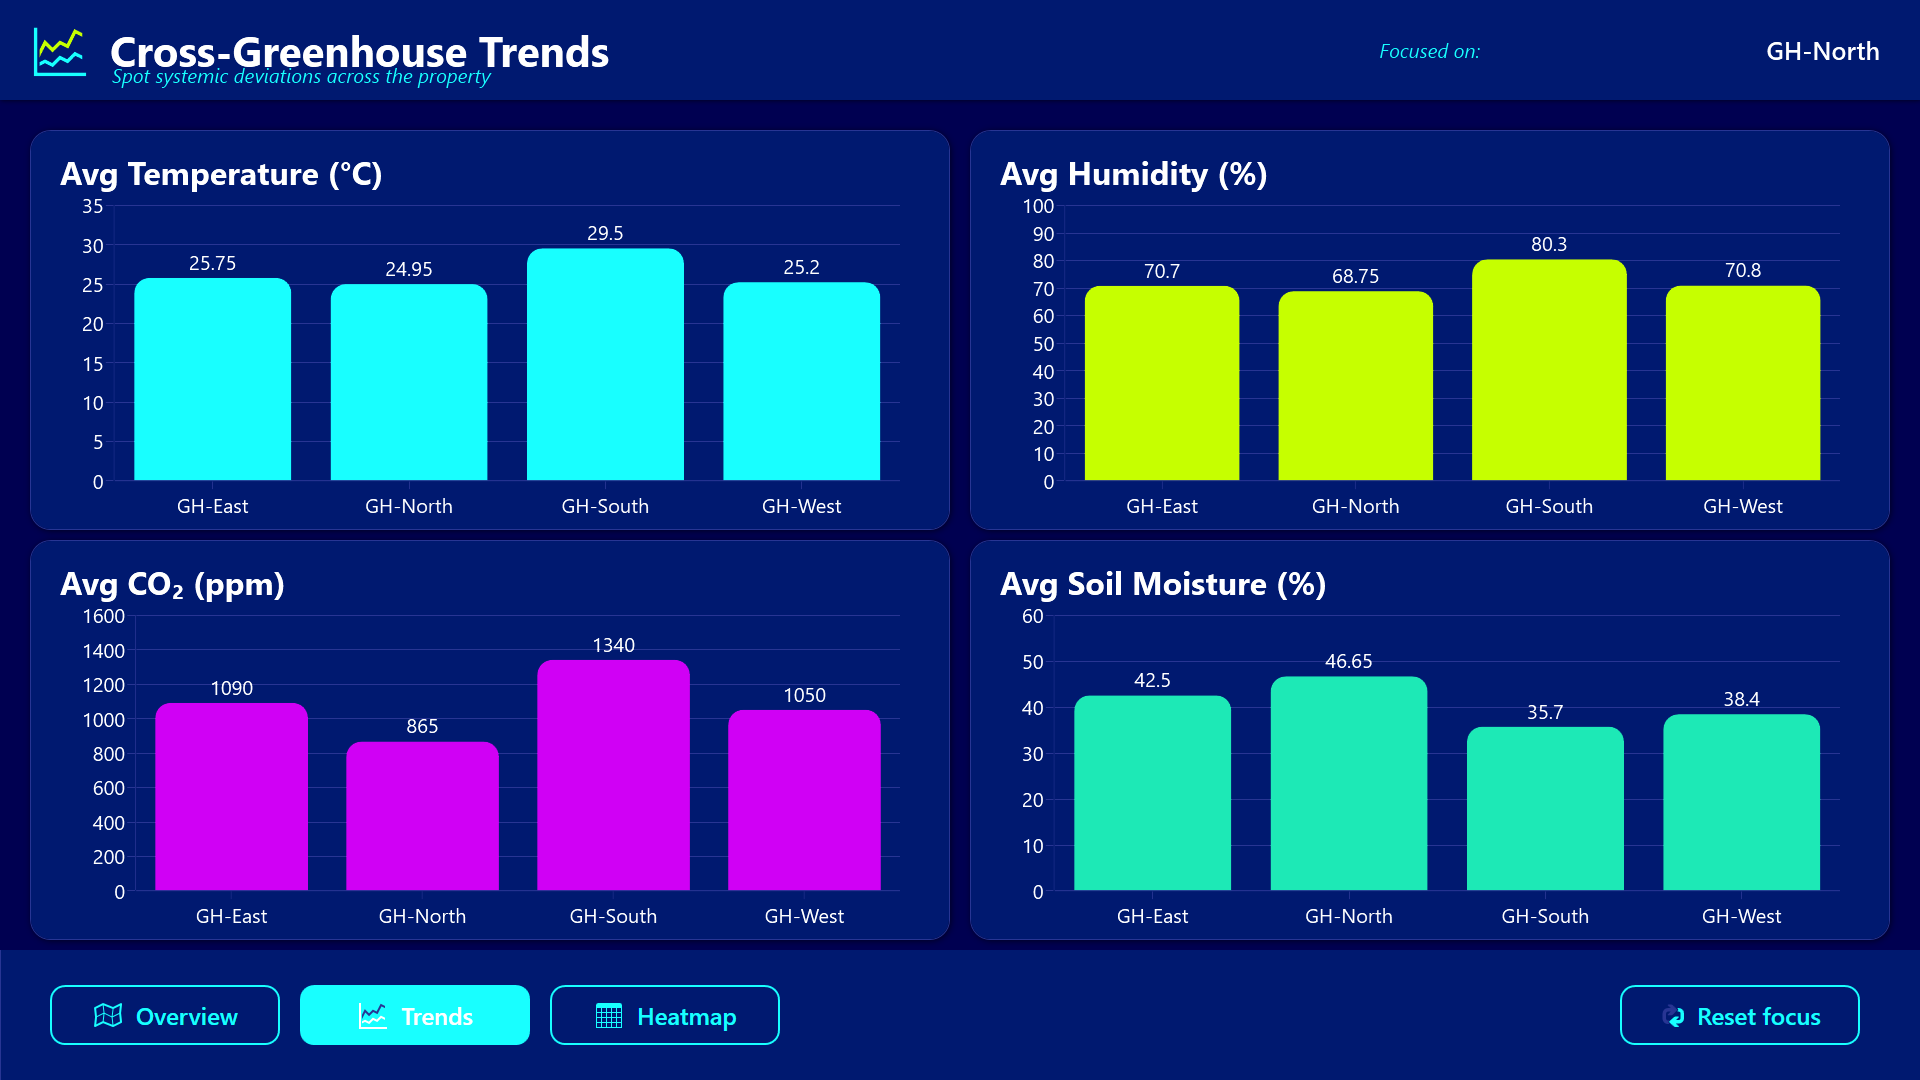
The Trends screen shows four side-by-side bar charts comparing average temperature, humidity, CO2, and soil moisture across the four greenhouses.
The Heatmap screen is a scrollable tile grid where every zone in the property is colored by a computed deviation score (distance from target band), so the supervisor can triage at-a-glance without reading numbers.
The shared backbone
What makes the two apps “connected” rather than just “co-located” is a single hub list called ZoneReadings (technically named greenhouse_ZoneReadings on the hub for unique addressing). Both apps read from the same list. The office writes acknowledgement fields (Acknowledged, AcknowledgedBy, AcknowledgedAt, AcknowledgeComment) directly on the hub. The floor app, which filters the same list down to its own GreenhouseId, sees the row disappear from its active-alarm screen within fifteen seconds.
A second shared list, greenhouse_ZoneCheckLog, captures the manual checks. Three Hub-MQTT variables (active operator, global alert level, last-ack timestamp) are pushed from the office to every floor screen so the floor knows who is on the desk and how bad things look property-wide without making its own aggregation queries.
Result
The result is a closed loop: every alarm has exactly one official acknowledgement path (the office), every floor screen sees the world the same way (because they read from the same list), and every manual check is durable evidence the supervisor can audit later. Over-alerting drops because acknowledging in the office immediately clears the floor; under-acknowledgement drops because the office is staring at the same list the floor is staring at. The deliberate two-second leaf-hold on the floor and the bulk-acknowledge modal in the office are small ergonomic details, but together they prevent the two most common failure modes of dashboards in noisy industrial environments: accidental taps and acknowledgement fatigue.